VisakaIndustries VISAKAIND full analysis,charts,indicators,moving averages,SMA,DMA,EMA,ADX,MACD,RSIVisaka Industries VISAKAIND WideScreen charts, DMA,SMA,EMA technical analysis, forecast prediction, by indicators ADX,MACD,RSI,CCI NSE stock exchange
operates under Cement & Cement Products sector
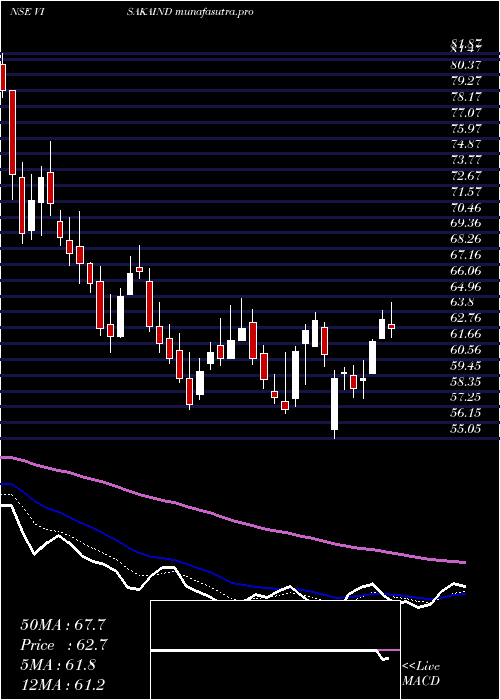
Daily price and charts and targets VisakaIndustries Strong Daily Stock price targets for VisakaIndustries VISAKAIND are 77.61 and 80.01 | Daily Target 1 | 76.97 | | Daily Target 2 | 78.24 | | Daily Target 3 | 79.37 | | Daily Target 4 | 80.64 | | Daily Target 5 | 81.77 |
Daily price and volume Visaka Industries
| Date |
Closing |
Open |
Range |
Volume |
Wed 29 October 2025 |
79.51 (-0.03%) |
80.00 |
78.10 - 80.50 |
1.4851 times |
Tue 28 October 2025 |
79.53 (-1.36%) |
80.26 |
79.10 - 81.90 |
1.1059 times |
Mon 27 October 2025 |
80.63 (-0.4%) |
80.60 |
79.70 - 81.70 |
1.4032 times |
Fri 24 October 2025 |
80.95 (-0.34%) |
81.00 |
80.50 - 82.01 |
0.8479 times |
Thu 23 October 2025 |
81.23 (-0.93%) |
82.10 |
80.03 - 83.49 |
1.1424 times |
Tue 21 October 2025 |
81.99 (1.99%) |
81.90 |
81.00 - 82.49 |
0.5908 times |
Mon 20 October 2025 |
80.39 (0.97%) |
80.20 |
79.20 - 81.00 |
0.7684 times |
Fri 17 October 2025 |
79.62 (-1.84%) |
81.43 |
79.50 - 81.74 |
0.9367 times |
Thu 16 October 2025 |
81.11 (0.27%) |
81.50 |
80.10 - 82.40 |
0.8655 times |
Wed 15 October 2025 |
80.89 (1.67%) |
80.08 |
79.46 - 81.73 |
0.8541 times |
Tue 14 October 2025 |
79.56 (-1.01%) |
80.80 |
79.38 - 81.57 |
2.0332 times |
Weekly price and charts VisakaIndustries Strong weekly Stock price targets for VisakaIndustries VISAKAIND are 76.91 and 80.71 | Weekly Target 1 | 76.04 | | Weekly Target 2 | 77.77 | | Weekly Target 3 | 79.836666666667 | | Weekly Target 4 | 81.57 | | Weekly Target 5 | 83.64 |
Weekly price and volumes for Visaka Industries
| Date |
Closing |
Open |
Range |
Volume |
Wed 29 October 2025 |
79.51 (-1.78%) |
80.60 |
78.10 - 81.90 |
0.3055 times |
Fri 24 October 2025 |
80.95 (1.67%) |
80.20 |
79.20 - 83.49 |
0.2562 times |
Fri 17 October 2025 |
79.62 (-4.53%) |
83.67 |
79.38 - 84.58 |
0.5338 times |
Fri 10 October 2025 |
83.40 (-8.14%) |
81.99 |
79.02 - 88.25 |
1.8899 times |
Wed 02 July 2025 |
90.79 (5.96%) |
85.35 |
85.35 - 98.10 |
3.0377 times |
Fri 27 June 2025 |
85.68 (6.12%) |
80.10 |
79.05 - 88.60 |
0.8928 times |
Fri 20 June 2025 |
80.74 (-3.46%) |
83.00 |
78.25 - 84.25 |
0.4678 times |
Fri 13 June 2025 |
83.63 (0.08%) |
84.20 |
82.05 - 88.90 |
0.8576 times |
Fri 06 June 2025 |
83.56 (-2.2%) |
85.49 |
83.02 - 85.99 |
0.7352 times |
Fri 30 May 2025 |
85.44 (3.45%) |
82.80 |
82.64 - 87.95 |
1.0236 times |
Fri 23 May 2025 |
82.59 (11.29%) |
74.50 |
74.49 - 91.50 |
5.734 times |
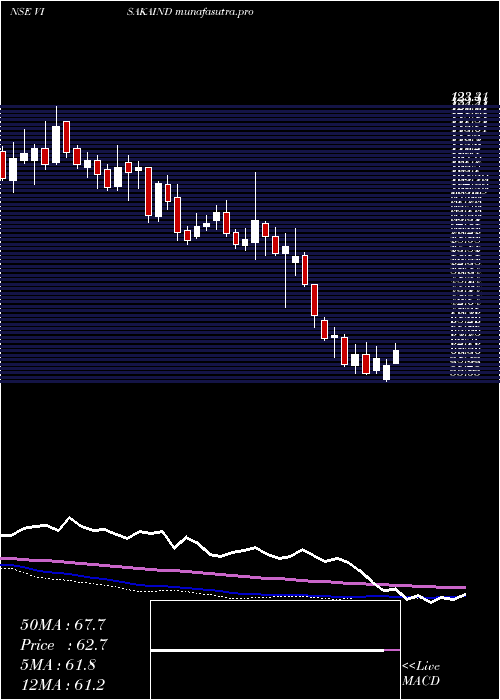
Monthly price and charts VisakaIndustries Strong monthly Stock price targets for VisakaIndustries VISAKAIND are 73.73 and 83.88 | Monthly Target 1 | 71.8 | | Monthly Target 2 | 75.66 | | Monthly Target 3 | 81.953333333333 | | Monthly Target 4 | 85.81 | | Monthly Target 5 | 92.1 |
Monthly price and volumes Visaka Industries
| Date |
Closing |
Open |
Range |
Volume |
Wed 29 October 2025 |
79.51 (-12.42%) |
81.99 |
78.10 - 88.25 |
0.5364 times |
Wed 02 July 2025 |
90.79 (-2.62%) |
93.71 |
90.11 - 98.10 |
0.2511 times |
Mon 30 June 2025 |
93.23 (9.12%) |
85.49 |
78.25 - 93.80 |
0.8254 times |
Fri 30 May 2025 |
85.44 (37.72%) |
61.10 |
57.01 - 91.50 |
1.8937 times |
Wed 30 April 2025 |
62.04 (8.67%) |
57.80 |
55.05 - 65.80 |
0.7004 times |
Fri 28 March 2025 |
57.09 (-13.3%) |
66.00 |
56.81 - 68.50 |
1.7476 times |
Fri 28 February 2025 |
65.85 (-25.7%) |
84.63 |
65.24 - 93.10 |
0.7783 times |
Fri 31 January 2025 |
88.63 (-0.46%) |
89.59 |
73.42 - 107.00 |
1.8661 times |
Tue 31 December 2024 |
89.04 (-4.8%) |
93.65 |
87.73 - 100.00 |
0.7376 times |
Fri 29 November 2024 |
93.53 (-8.38%) |
102.08 |
89.05 - 106.15 |
0.6634 times |
Thu 31 October 2024 |
102.08 (-1.25%) |
103.13 |
94.50 - 113.75 |
1.5715 times |
DMA SMA EMA moving averages of Visaka Industries VISAKAIND
DMA (daily moving average) of Visaka Industries VISAKAIND
| DMA period | DMA value | | 5 day DMA | 80.37 | | 12 day DMA | 80.48 | | 20 day DMA | 83.02 | | 35 day DMA | 83.21 | | 50 day DMA | 83.83 | | 100 day DMA | 72.93 | | 150 day DMA | 77.15 | | 200 day DMA | 82.51 | EMA (exponential moving average) of Visaka Industries VISAKAIND
| EMA period | EMA current | EMA prev | EMA prev2 | | 5 day EMA | 80.15 | 80.47 | 80.94 | | 12 day EMA | 81.01 | 81.28 | 81.6 | | 20 day EMA | 81.69 | 81.92 | 82.17 | | 35 day EMA | 81.99 | 82.14 | 82.29 | | 50 day EMA | 82.02 | 82.12 | 82.23 |
SMA (simple moving average) of Visaka Industries VISAKAIND
| SMA period | SMA current | SMA prev | SMA prev2 | | 5 day SMA | 80.37 | 80.87 | 81.04 | | 12 day SMA | 80.48 | 80.81 | 81.39 | | 20 day SMA | 83.02 | 83.33 | 83.58 | | 35 day SMA | 83.21 | 83.33 | 83.46 | | 50 day SMA | 83.83 | 83.72 | 83.55 | | 100 day SMA | 72.93 | 72.81 | 72.7 | | 150 day SMA | 77.15 | 77.26 | 77.38 | | 200 day SMA | 82.51 | 82.65 | 82.77 |
|
|
