Vipul VIPULLTD full analysis,charts,indicators,moving averages,SMA,DMA,EMA,ADX,MACD,RSIVipul VIPULLTD WideScreen charts, DMA,SMA,EMA technical analysis, forecast prediction, by indicators ADX,MACD,RSI,CCI NSE stock exchange
operates under Realty sector
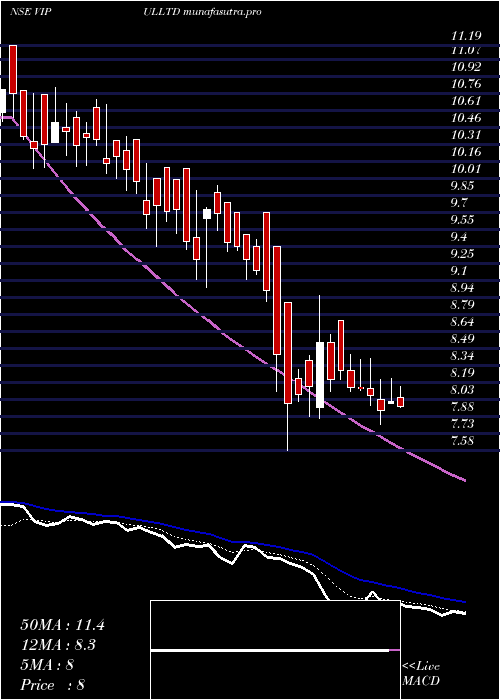
Daily price and charts and targets Vipul Strong Daily Stock price targets for Vipul VIPULLTD are 7.67 and 8.07 | Daily Target 1 | 7.58 | | Daily Target 2 | 7.76 | | Daily Target 3 | 7.9833333333333 | | Daily Target 4 | 8.16 | | Daily Target 5 | 8.38 |
Daily price and volume Vipul
| Date |
Closing |
Open |
Range |
Volume |
Tue 28 October 2025 |
7.93 (-1.73%) |
8.03 |
7.81 - 8.21 |
0.7616 times |
Mon 27 October 2025 |
8.07 (-0.74%) |
8.13 |
7.98 - 8.40 |
0.4773 times |
Fri 24 October 2025 |
8.13 (-0.12%) |
8.14 |
8.11 - 8.39 |
0.5144 times |
Thu 23 October 2025 |
8.14 (-1.81%) |
8.29 |
8.10 - 8.43 |
0.895 times |
Tue 21 October 2025 |
8.29 (0.97%) |
8.74 |
8.21 - 8.74 |
0.1169 times |
Mon 20 October 2025 |
8.21 (-3.86%) |
8.54 |
8.10 - 8.61 |
1.102 times |
Fri 17 October 2025 |
8.54 (4.79%) |
7.96 |
7.86 - 8.96 |
1.07 times |
Thu 16 October 2025 |
8.15 (0.87%) |
8.38 |
7.88 - 8.42 |
0.9216 times |
Wed 15 October 2025 |
8.08 (1%) |
8.22 |
8.01 - 8.30 |
0.8608 times |
Tue 14 October 2025 |
8.00 (-5.1%) |
8.90 |
7.58 - 8.90 |
3.2804 times |
Mon 13 October 2025 |
8.43 (-6.33%) |
9.40 |
8.10 - 9.40 |
11.8961 times |
Weekly price and charts Vipul Strong weekly Stock price targets for Vipul VIPULLTD are 7.58 and 8.17 | Weekly Target 1 | 7.46 | | Weekly Target 2 | 7.69 | | Weekly Target 3 | 8.0466666666667 | | Weekly Target 4 | 8.28 | | Weekly Target 5 | 8.64 |
Weekly price and volumes for Vipul
| Date |
Closing |
Open |
Range |
Volume |
Tue 28 October 2025 |
7.93 (-2.46%) |
8.13 |
7.81 - 8.40 |
0.2912 times |
Fri 24 October 2025 |
8.13 (-4.8%) |
8.54 |
8.10 - 8.74 |
0.6178 times |
Fri 17 October 2025 |
8.54 (-5.11%) |
9.40 |
7.58 - 9.40 |
4.2375 times |
Fri 10 October 2025 |
9.00 (-7.12%) |
9.79 |
8.91 - 9.79 |
0.5451 times |
Fri 03 October 2025 |
9.69 (-0.41%) |
10.09 |
9.03 - 10.09 |
0.7002 times |
Fri 26 September 2025 |
9.73 (-3.47%) |
10.35 |
9.40 - 10.35 |
0.618 times |
Fri 19 September 2025 |
10.08 (-2.14%) |
10.40 |
9.90 - 10.71 |
0.6352 times |
Fri 12 September 2025 |
10.30 (-0.77%) |
10.33 |
10.09 - 10.81 |
1.1981 times |
Fri 05 September 2025 |
10.38 (7.12%) |
9.69 |
9.69 - 11.19 |
0.8146 times |
Fri 29 August 2025 |
9.69 (0%) |
9.88 |
9.52 - 10.28 |
0.3423 times |
Fri 22 August 2025 |
9.69 (-6.01%) |
10.25 |
9.44 - 10.63 |
1.1248 times |

Monthly price and charts Vipul Strong monthly Stock price targets for Vipul VIPULLTD are 6.58 and 8.94 | Monthly Target 1 | 6.12 | | Monthly Target 2 | 7.03 | | Monthly Target 3 | 8.4833333333333 | | Monthly Target 4 | 9.39 | | Monthly Target 5 | 10.84 |
Monthly price and volumes Vipul
| Date |
Closing |
Open |
Range |
Volume |
Tue 28 October 2025 |
7.93 (-14.55%) |
9.65 |
7.58 - 9.94 |
0.6373 times |
Tue 30 September 2025 |
9.28 (-4.23%) |
9.69 |
9.10 - 11.19 |
0.3747 times |
Fri 29 August 2025 |
9.69 (-72.73%) |
10.64 |
9.44 - 11.91 |
0.6069 times |
Wed 18 September 2024 |
35.54 (-0.78%) |
35.82 |
33.50 - 36.80 |
2.3372 times |
Fri 30 August 2024 |
35.82 (-15.42%) |
43.39 |
29.43 - 43.40 |
3.7056 times |
Wed 31 July 2024 |
42.35 (28.72%) |
44.99 |
41.52 - 53.01 |
1.3481 times |
Mon 04 March 2024 |
32.90 (15.44%) |
29.90 |
29.90 - 32.90 |
0.2786 times |
Thu 29 February 2024 |
28.50 (82.11%) |
16.25 |
15.00 - 28.50 |
0.2183 times |
Wed 31 January 2024 |
15.65 (-9.28%) |
17.40 |
15.50 - 19.10 |
0.3622 times |
Fri 29 December 2023 |
17.25 (-6.5%) |
18.45 |
16.05 - 19.60 |
0.1311 times |
Thu 30 November 2023 |
18.45 (9.5%) |
17.45 |
17.15 - 20.40 |
0.3895 times |

DMA SMA EMA moving averages of Vipul VIPULLTD
DMA (daily moving average) of Vipul VIPULLTD
| DMA period | DMA value | | 5 day DMA | 8.11 | | 12 day DMA | 8.25 | | 20 day DMA | 8.72 | | 35 day DMA | 9.32 | | 50 day DMA | 9.55 | | 100 day DMA | 21.09 | | 150 day DMA | 23.2 | | 200 day DMA | 21.96 | EMA (exponential moving average) of Vipul VIPULLTD
| EMA period | EMA current | EMA prev | EMA prev2 | | 5 day EMA | 8.09 | 8.17 | 8.22 | | 12 day EMA | 8.35 | 8.43 | 8.49 | | 20 day EMA | 8.64 | 8.72 | 8.79 | | 35 day EMA | 9.03 | 9.09 | 9.15 | | 50 day EMA | 9.45 | 9.51 | 9.57 |
SMA (simple moving average) of Vipul VIPULLTD
| SMA period | SMA current | SMA prev | SMA prev2 | | 5 day SMA | 8.11 | 8.17 | 8.26 | | 12 day SMA | 8.25 | 8.35 | 8.45 | | 20 day SMA | 8.72 | 8.81 | 8.89 | | 35 day SMA | 9.32 | 9.39 | 9.47 | | 50 day SMA | 9.55 | 9.6 | 9.63 | | 100 day SMA | 21.09 | 21.44 | 21.82 | | 150 day SMA | 23.2 | 23.27 | 23.34 | | 200 day SMA | 21.96 | 22 | 22.05 |
|
|
