VipIndustries VIPIND full analysis,charts,indicators,moving averages,SMA,DMA,EMA,ADX,MACD,RSIVip Industries VIPIND WideScreen charts, DMA,SMA,EMA technical analysis, forecast prediction, by indicators ADX,MACD,RSI,CCI NSE stock exchange
operates under Other Apparels & Accessories sector
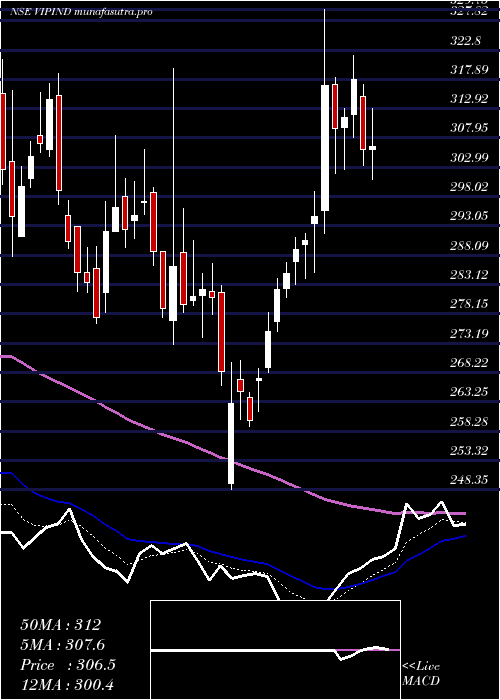
Daily price and charts and targets VipIndustries Strong Daily Stock price targets for VipIndustries VIPIND are 412.73 and 424.83 | Daily Target 1 | 410.15 | | Daily Target 2 | 415.3 | | Daily Target 3 | 422.25 | | Daily Target 4 | 427.4 | | Daily Target 5 | 434.35 |
Daily price and volume Vip Industries
| Date |
Closing |
Open |
Range |
Volume |
Tue 28 October 2025 |
420.45 (-1.24%) |
425.45 |
417.10 - 429.20 |
0.7226 times |
Mon 27 October 2025 |
425.75 (-0.26%) |
426.85 |
424.05 - 432.65 |
1.3129 times |
Fri 24 October 2025 |
426.85 (-0.79%) |
430.20 |
421.05 - 434.60 |
0.6234 times |
Thu 23 October 2025 |
430.25 (-2.07%) |
439.50 |
428.25 - 441.60 |
1.0502 times |
Tue 21 October 2025 |
439.35 (1.5%) |
438.20 |
435.05 - 440.40 |
0.6628 times |
Mon 20 October 2025 |
432.85 (1.41%) |
425.00 |
422.90 - 434.00 |
0.8518 times |
Fri 17 October 2025 |
426.85 (-0.25%) |
432.00 |
425.45 - 447.30 |
2.2338 times |
Thu 16 October 2025 |
427.90 (0.52%) |
426.95 |
425.15 - 433.70 |
1.3938 times |
Wed 15 October 2025 |
425.70 (0.97%) |
418.10 |
418.05 - 428.05 |
0.8271 times |
Tue 14 October 2025 |
421.60 (-1.62%) |
422.20 |
420.10 - 430.95 |
0.3216 times |
Mon 13 October 2025 |
428.55 (-1.04%) |
428.90 |
424.40 - 432.20 |
0.4521 times |
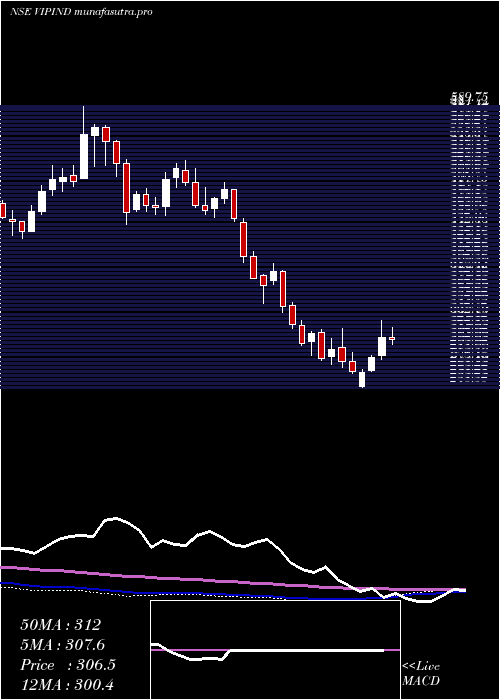
Weekly price and charts VipIndustries Strong weekly Stock price targets for VipIndustries VIPIND are 411 and 426.55 | Weekly Target 1 | 407.85 | | Weekly Target 2 | 414.15 | | Weekly Target 3 | 423.4 | | Weekly Target 4 | 429.7 | | Weekly Target 5 | 438.95 |
Weekly price and volumes for Vip Industries
| Date |
Closing |
Open |
Range |
Volume |
Tue 28 October 2025 |
420.45 (-1.5%) |
426.85 |
417.10 - 432.65 |
0.3835 times |
Fri 24 October 2025 |
426.85 (0%) |
425.00 |
421.05 - 441.60 |
0.6007 times |
Fri 17 October 2025 |
426.85 (-1.43%) |
428.90 |
418.05 - 447.30 |
0.9851 times |
Fri 10 October 2025 |
433.05 (2.95%) |
420.25 |
418.75 - 435.20 |
0.6726 times |
Fri 03 October 2025 |
420.65 (2.74%) |
410.00 |
404.05 - 424.00 |
0.5431 times |
Fri 26 September 2025 |
409.45 (-9%) |
445.50 |
395.00 - 452.00 |
1.63 times |
Fri 19 September 2025 |
449.95 (2.06%) |
438.30 |
436.20 - 454.30 |
1.2118 times |
Fri 12 September 2025 |
440.85 (4.16%) |
424.30 |
420.05 - 454.00 |
1.6132 times |
Fri 05 September 2025 |
423.25 (0.99%) |
419.00 |
418.10 - 440.70 |
1.1626 times |
Fri 29 August 2025 |
419.10 (-2.55%) |
427.95 |
410.55 - 435.30 |
1.1972 times |
Fri 22 August 2025 |
430.05 (4.84%) |
411.00 |
408.05 - 432.95 |
0.9381 times |
Monthly price and charts VipIndustries Strong monthly Stock price targets for VipIndustries VIPIND are 416.23 and 451.53 | Monthly Target 1 | 391.28 | | Monthly Target 2 | 405.87 | | Monthly Target 3 | 426.58333333333 | | Monthly Target 4 | 441.17 | | Monthly Target 5 | 461.88 |
Monthly price and volumes Vip Industries
| Date |
Closing |
Open |
Range |
Volume |
Tue 28 October 2025 |
420.45 (1.08%) |
412.00 |
412.00 - 447.30 |
0.2803 times |
Tue 30 September 2025 |
415.95 (-0.75%) |
419.00 |
395.00 - 454.30 |
0.5855 times |
Fri 29 August 2025 |
419.10 (-6.5%) |
448.25 |
399.55 - 466.00 |
0.5017 times |
Thu 31 July 2025 |
448.25 (6.43%) |
422.60 |
410.20 - 492.30 |
2.0662 times |
Mon 30 June 2025 |
421.15 (16.44%) |
364.00 |
341.00 - 439.90 |
2.0024 times |
Fri 30 May 2025 |
361.70 (18.22%) |
305.95 |
298.25 - 391.85 |
1.2889 times |
Wed 30 April 2025 |
305.95 (9.39%) |
280.35 |
248.35 - 329.75 |
0.8386 times |
Fri 28 March 2025 |
279.70 (-7.55%) |
304.05 |
272.90 - 319.70 |
1.2571 times |
Fri 28 February 2025 |
302.55 (-18.69%) |
379.00 |
300.00 - 398.70 |
0.4383 times |
Fri 31 January 2025 |
372.10 (-22.5%) |
484.50 |
350.05 - 497.70 |
0.7412 times |
Tue 31 December 2024 |
480.15 (-6.74%) |
512.05 |
455.25 - 524.00 |
0.5625 times |
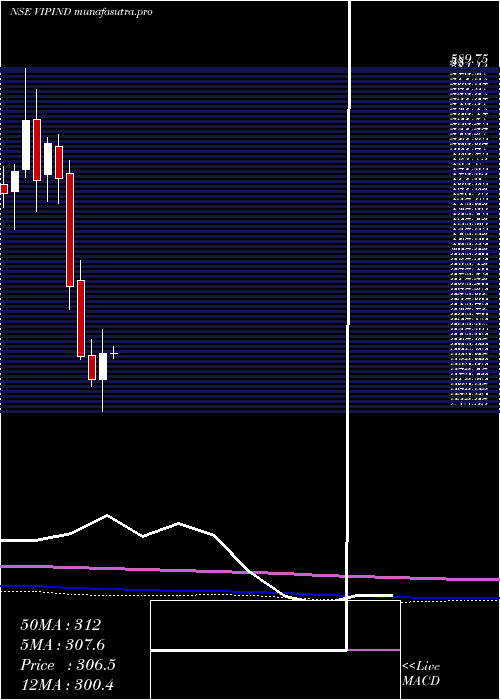
DMA SMA EMA moving averages of Vip Industries VIPIND
DMA (daily moving average) of Vip Industries VIPIND
| DMA period | DMA value | | 5 day DMA | 428.53 | | 12 day DMA | 428.26 | | 20 day DMA | 425.55 | | 35 day DMA | 431.59 | | 50 day DMA | 429.24 | | 100 day DMA | 429.69 | | 150 day DMA | 392.25 | | 200 day DMA | 384.14 | EMA (exponential moving average) of Vip Industries VIPIND
| EMA period | EMA current | EMA prev | EMA prev2 | | 5 day EMA | 425.87 | 428.58 | 429.99 | | 12 day EMA | 427.32 | 428.57 | 429.08 | | 20 day EMA | 427.82 | 428.59 | 428.89 | | 35 day EMA | 427.65 | 428.07 | 428.21 | | 50 day EMA | 428.5 | 428.83 | 428.96 |
SMA (simple moving average) of Vip Industries VIPIND
| SMA period | SMA current | SMA prev | SMA prev2 | | 5 day SMA | 428.53 | 431.01 | 431.23 | | 12 day SMA | 428.26 | 428.73 | 428.39 | | 20 day SMA | 425.55 | 425 | 425.02 | | 35 day SMA | 431.59 | 431.67 | 431.93 | | 50 day SMA | 429.24 | 428.95 | 428.69 | | 100 day SMA | 429.69 | 429.07 | 428.41 | | 150 day SMA | 392.25 | 391.42 | 390.53 | | 200 day SMA | 384.14 | 384.43 | 384.74 |
|
|
