VipClothing VIPCLOTHNG full analysis,charts,indicators,moving averages,SMA,DMA,EMA,ADX,MACD,RSIVip Clothing VIPCLOTHNG WideScreen charts, DMA,SMA,EMA technical analysis, forecast prediction, by indicators ADX,MACD,RSI,CCI NSE stock exchange
operates under Comm.Trading & Distribution sector
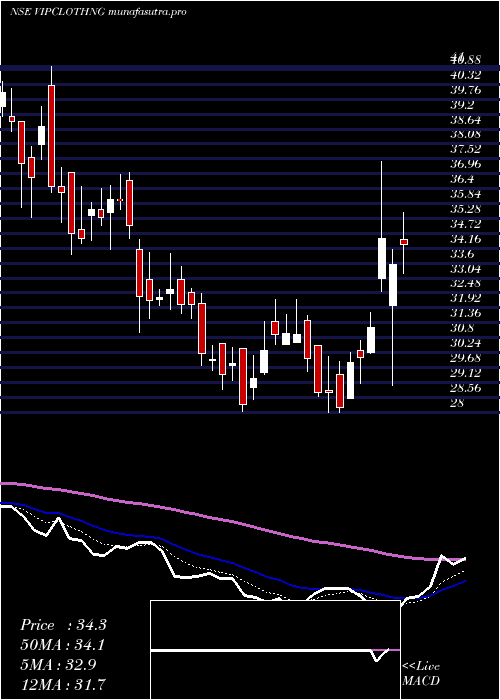
Daily price and charts and targets VipClothing Strong Daily Stock price targets for VipClothing VIPCLOTHNG are 33.15 and 34.02 | Daily Target 1 | 32.91 | | Daily Target 2 | 33.39 | | Daily Target 3 | 33.78 | | Daily Target 4 | 34.26 | | Daily Target 5 | 34.65 |
Daily price and volume Vip Clothing
| Date |
Closing |
Open |
Range |
Volume |
Wed 29 October 2025 |
33.87 (0.77%) |
34.00 |
33.30 - 34.17 |
0.6511 times |
Tue 28 October 2025 |
33.61 (-2.72%) |
35.00 |
33.25 - 35.01 |
1.2965 times |
Mon 27 October 2025 |
34.55 (-0.26%) |
35.37 |
34.50 - 35.98 |
1.0073 times |
Fri 24 October 2025 |
34.64 (2.67%) |
33.74 |
33.50 - 36.80 |
1.8077 times |
Thu 23 October 2025 |
33.74 (1.2%) |
33.65 |
33.25 - 34.70 |
1.4161 times |
Tue 21 October 2025 |
33.34 (0.18%) |
33.28 |
33.06 - 33.69 |
0.2516 times |
Mon 20 October 2025 |
33.28 (-0.27%) |
33.37 |
32.67 - 33.63 |
0.8251 times |
Fri 17 October 2025 |
33.37 (-1.74%) |
34.30 |
33.29 - 34.30 |
0.6646 times |
Thu 16 October 2025 |
33.96 (0.65%) |
33.90 |
33.66 - 34.11 |
0.4329 times |
Wed 15 October 2025 |
33.74 (-0.56%) |
34.25 |
33.55 - 34.50 |
1.6471 times |
Tue 14 October 2025 |
33.93 (-1.62%) |
34.49 |
33.60 - 34.72 |
0.7963 times |
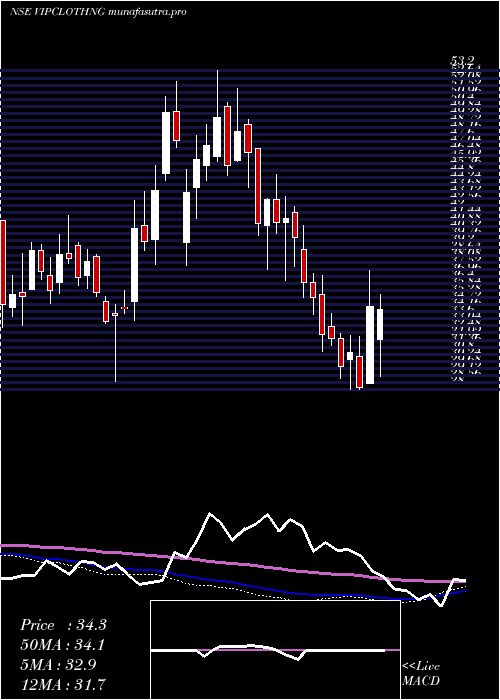
Weekly price and charts VipClothing Strong weekly Stock price targets for VipClothing VIPCLOTHNG are 32.2 and 34.93 | Weekly Target 1 | 31.64 | | Weekly Target 2 | 32.75 | | Weekly Target 3 | 34.366666666667 | | Weekly Target 4 | 35.48 | | Weekly Target 5 | 37.1 |
Weekly price and volumes for Vip Clothing
| Date |
Closing |
Open |
Range |
Volume |
Wed 29 October 2025 |
33.87 (-2.22%) |
35.37 |
33.25 - 35.98 |
0.2664 times |
Fri 24 October 2025 |
34.64 (3.81%) |
33.37 |
32.67 - 36.80 |
0.3877 times |
Fri 17 October 2025 |
33.37 (-4%) |
34.25 |
33.29 - 34.99 |
0.3641 times |
Fri 10 October 2025 |
34.76 (2.21%) |
34.00 |
33.72 - 36.00 |
1.2359 times |
Fri 03 October 2025 |
34.01 (-4.63%) |
35.55 |
33.50 - 36.19 |
1.339 times |
Fri 26 September 2025 |
35.66 (-12.08%) |
41.20 |
34.78 - 41.20 |
2.0882 times |
Fri 19 September 2025 |
40.56 (20.07%) |
33.50 |
33.50 - 40.94 |
2.4579 times |
Fri 12 September 2025 |
33.78 (-0.62%) |
34.50 |
33.52 - 34.93 |
0.5649 times |
Fri 05 September 2025 |
33.99 (-3.87%) |
35.36 |
33.86 - 35.75 |
1.0647 times |
Fri 29 August 2025 |
35.36 (-3.99%) |
36.83 |
35.03 - 37.11 |
0.2313 times |
Fri 22 August 2025 |
36.83 (-3.21%) |
38.50 |
35.99 - 38.50 |
1.0044 times |
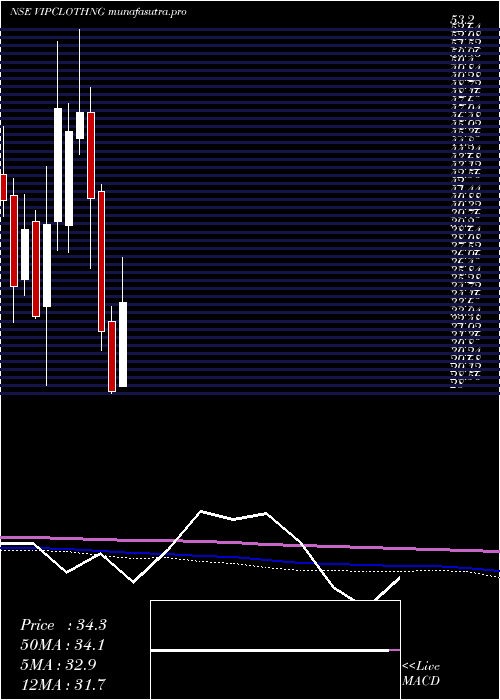
Monthly price and charts VipClothing Strong monthly Stock price targets for VipClothing VIPCLOTHNG are 33.27 and 37.4 | Monthly Target 1 | 30.32 | | Monthly Target 2 | 32.09 | | Monthly Target 3 | 34.446666666667 | | Monthly Target 4 | 36.22 | | Monthly Target 5 | 38.58 |
Monthly price and volumes Vip Clothing
| Date |
Closing |
Open |
Range |
Volume |
Wed 29 October 2025 |
33.87 (0.18%) |
33.50 |
32.67 - 36.80 |
0.3485 times |
Tue 30 September 2025 |
33.81 (-4.38%) |
35.36 |
33.50 - 41.20 |
0.9381 times |
Fri 29 August 2025 |
35.36 (-9.47%) |
39.25 |
35.03 - 41.48 |
0.412 times |
Thu 31 July 2025 |
39.06 (-2.4%) |
39.88 |
37.80 - 44.30 |
1.2559 times |
Mon 30 June 2025 |
40.02 (3.87%) |
40.49 |
38.56 - 43.39 |
0.5499 times |
Thu 17 April 2025 |
38.53 (36.68%) |
28.50 |
28.50 - 42.50 |
2.1103 times |
Fri 28 March 2025 |
28.19 (-12.81%) |
32.98 |
28.00 - 34.01 |
0.5864 times |
Fri 28 February 2025 |
32.33 (-22.13%) |
42.00 |
31.00 - 42.51 |
0.2325 times |
Fri 31 January 2025 |
41.52 (-12.52%) |
47.46 |
36.64 - 49.20 |
0.7509 times |
Tue 31 December 2024 |
47.46 (2.82%) |
45.70 |
44.53 - 53.20 |
2.8155 times |
Fri 29 November 2024 |
46.16 (-3.27%) |
39.64 |
37.81 - 48.11 |
0.5972 times |
DMA SMA EMA moving averages of Vip Clothing VIPCLOTHNG
DMA (daily moving average) of Vip Clothing VIPCLOTHNG
| DMA period | DMA value | | 5 day DMA | 34.08 | | 12 day DMA | 33.88 | | 20 day DMA | 34.01 | | 35 day DMA | 34.91 | | 50 day DMA | 35.09 | | 100 day DMA | 37.48 | | 150 day DMA | 36.5 | | 200 day DMA | 38.85 | EMA (exponential moving average) of Vip Clothing VIPCLOTHNG
| EMA period | EMA current | EMA prev | EMA prev2 | | 5 day EMA | 33.94 | 33.97 | 34.15 | | 12 day EMA | 34.04 | 34.07 | 34.15 | | 20 day EMA | 34.3 | 34.34 | 34.42 | | 35 day EMA | 34.68 | 34.73 | 34.8 | | 50 day EMA | 35.25 | 35.31 | 35.38 |
SMA (simple moving average) of Vip Clothing VIPCLOTHNG
| SMA period | SMA current | SMA prev | SMA prev2 | | 5 day SMA | 34.08 | 33.98 | 33.91 | | 12 day SMA | 33.88 | 33.95 | 34.02 | | 20 day SMA | 34.01 | 34.02 | 34.12 | | 35 day SMA | 34.91 | 34.91 | 34.92 | | 50 day SMA | 35.09 | 35.18 | 35.27 | | 100 day SMA | 37.48 | 37.49 | 37.47 | | 150 day SMA | 36.5 | 36.56 | 36.63 | | 200 day SMA | 38.85 | 38.92 | 38.99 |
|
|
