VinsysIt VINSYS_SM full analysis,charts,indicators,moving averages,SMA,DMA,EMA,ADX,MACD,RSIVinsys It VINSYS_SM WideScreen charts, DMA,SMA,EMA technical analysis, forecast prediction, by indicators ADX,MACD,RSI,CCI NSE stock exchange
Daily price and charts and targets VinsysIt Strong Daily Stock price targets for VinsysIt VINSYS_SM are 384.98 and 394.93 | Daily Target 1 | 376.68 | | Daily Target 2 | 383.32 | | Daily Target 3 | 386.63333333333 | | Daily Target 4 | 393.27 | | Daily Target 5 | 396.58 |
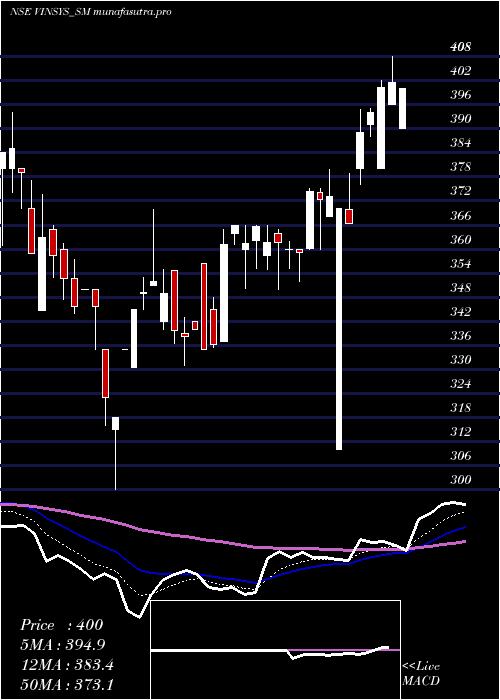
Daily price and volume Vinsys It
| Date |
Closing |
Open |
Range |
Volume |
Wed 29 October 2025 |
389.95 (-0.01%) |
380.00 |
380.00 - 389.95 |
0.4124 times |
Tue 28 October 2025 |
390.00 (2.09%) |
383.00 |
380.00 - 398.00 |
2.1649 times |
Mon 27 October 2025 |
382.00 (0.26%) |
404.00 |
380.00 - 404.00 |
1.7526 times |
Fri 24 October 2025 |
381.00 (-3.52%) |
394.00 |
380.00 - 394.00 |
1.4433 times |
Thu 23 October 2025 |
394.90 (-1.28%) |
399.95 |
381.15 - 399.95 |
0.7216 times |
Tue 21 October 2025 |
400.00 (0.09%) |
400.10 |
400.00 - 400.10 |
0.2062 times |
Mon 20 October 2025 |
399.65 (1.95%) |
409.00 |
399.65 - 409.00 |
0.4124 times |
Fri 17 October 2025 |
392.00 (-0.81%) |
390.05 |
390.05 - 400.95 |
0.6186 times |
Thu 16 October 2025 |
395.20 (-1.11%) |
400.00 |
395.20 - 410.00 |
0.7216 times |
Wed 15 October 2025 |
399.65 (-1.25%) |
398.00 |
398.00 - 408.00 |
1.5464 times |
Tue 14 October 2025 |
404.70 (12.09%) |
360.50 |
360.30 - 427.40 |
5.8763 times |
Weekly price and charts VinsysIt Strong weekly Stock price targets for VinsysIt VINSYS_SM are 372.98 and 396.98 | Weekly Target 1 | 367.32 | | Weekly Target 2 | 378.63 | | Weekly Target 3 | 391.31666666667 | | Weekly Target 4 | 402.63 | | Weekly Target 5 | 415.32 |
Weekly price and volumes for Vinsys It
| Date |
Closing |
Open |
Range |
Volume |
Wed 29 October 2025 |
389.95 (2.35%) |
404.00 |
380.00 - 404.00 |
0.0895 times |
Fri 24 October 2025 |
381.00 (-2.81%) |
409.00 |
380.00 - 409.00 |
0.0576 times |
Fri 17 October 2025 |
392.00 (6.42%) |
362.05 |
360.15 - 427.40 |
0.1983 times |
Fri 10 October 2025 |
368.35 (-11.61%) |
427.00 |
357.20 - 427.00 |
0.4946 times |
Fri 03 October 2025 |
416.75 (-4.52%) |
440.00 |
411.50 - 445.00 |
0.2238 times |
Fri 26 September 2025 |
436.50 (-1.93%) |
435.00 |
434.00 - 468.00 |
0.7077 times |
Fri 19 September 2025 |
445.10 (6.2%) |
418.95 |
402.50 - 475.00 |
3.1379 times |
Fri 12 September 2025 |
419.10 (10.8%) |
394.00 |
370.05 - 421.50 |
2.1808 times |
Fri 05 September 2025 |
378.25 (-1.51%) |
384.25 |
370.40 - 397.95 |
0.8911 times |
Fri 29 August 2025 |
384.05 (0.5%) |
389.00 |
367.10 - 394.50 |
2.0188 times |
Fri 22 August 2025 |
382.15 (-1.92%) |
391.55 |
358.10 - 395.00 |
2.1253 times |

Monthly price and charts VinsysIt Strong monthly Stock price targets for VinsysIt VINSYS_SM are 337.15 and 410 | Monthly Target 1 | 319.55 | | Monthly Target 2 | 354.75 | | Monthly Target 3 | 392.4 | | Monthly Target 4 | 427.6 | | Monthly Target 5 | 465.25 |
Monthly price and volumes Vinsys It
| Date |
Closing |
Open |
Range |
Volume |
Wed 29 October 2025 |
389.95 (-6.49%) |
419.95 |
357.20 - 430.05 |
0.4574 times |
Tue 30 September 2025 |
417.00 (8.58%) |
384.25 |
370.05 - 475.00 |
3.3653 times |
Fri 29 August 2025 |
384.05 (8.95%) |
351.10 |
346.00 - 400.00 |
2.6343 times |
Thu 31 July 2025 |
352.50 (-8.32%) |
382.00 |
335.00 - 390.95 |
0.3441 times |
Mon 30 June 2025 |
384.50 (-2.44%) |
394.10 |
370.00 - 407.00 |
0.3145 times |
Fri 30 May 2025 |
394.10 (0.54%) |
392.00 |
370.00 - 436.00 |
0.6177 times |
Wed 30 April 2025 |
392.00 (8.89%) |
360.00 |
310.00 - 408.00 |
0.4441 times |
Fri 28 March 2025 |
360.00 (11.47%) |
315.05 |
300.00 - 369.95 |
0.4094 times |
Fri 28 February 2025 |
322.95 (-21.09%) |
400.00 |
316.05 - 421.95 |
0.4738 times |
Thu 30 January 2025 |
409.25 (-2.79%) |
425.00 |
383.00 - 450.00 |
0.9394 times |
Tue 31 December 2024 |
421.00 (20.65%) |
346.60 |
335.00 - 425.00 |
1.3457 times |

DMA SMA EMA moving averages of Vinsys It VINSYS_SM
DMA (daily moving average) of Vinsys It VINSYS_SM
| DMA period | DMA value | | 5 day DMA | 387.57 | | 12 day DMA | 390.84 | | 20 day DMA | 391.5 | | 35 day DMA | 405.69 | | 50 day DMA | 398.2 | | 100 day DMA | 385.82 | | 150 day DMA | 386.73 | | 200 day DMA | 386.03 | EMA (exponential moving average) of Vinsys It VINSYS_SM
| EMA period | EMA current | EMA prev | EMA prev2 | | 5 day EMA | 389.04 | 388.59 | 387.88 | | 12 day EMA | 391.24 | 391.47 | 391.74 | | 20 day EMA | 394.25 | 394.7 | 395.2 | | 35 day EMA | 393.15 | 393.34 | 393.54 | | 50 day EMA | 395.29 | 395.51 | 395.73 |
SMA (simple moving average) of Vinsys It VINSYS_SM
| SMA period | SMA current | SMA prev | SMA prev2 | | 5 day SMA | 387.57 | 389.58 | 391.51 | | 12 day SMA | 390.84 | 389.04 | 387.73 | | 20 day SMA | 391.5 | 393.79 | 396.11 | | 35 day SMA | 405.69 | 405.48 | 405.15 | | 50 day SMA | 398.2 | 398.19 | 398.2 | | 100 day SMA | 385.82 | 385.94 | 386.07 | | 150 day SMA | 386.73 | 386.37 | 386.01 | | 200 day SMA | 386.03 | 386.2 | 386.35 |
|
|
