VijayaDiagnostic VIJAYA full analysis,charts,indicators,moving averages,SMA,DMA,EMA,ADX,MACD,RSIVijaya Diagnostic VIJAYA WideScreen charts, DMA,SMA,EMA technical analysis, forecast prediction, by indicators ADX,MACD,RSI,CCI NSE stock exchange
Daily price and charts and targets VijayaDiagnostic Strong Daily Stock price targets for VijayaDiagnostic VIJAYA are 997.45 and 1008.05 | Daily Target 1 | 989.57 | | Daily Target 2 | 994.73 | | Daily Target 3 | 1000.1666666667 | | Daily Target 4 | 1005.33 | | Daily Target 5 | 1010.77 |
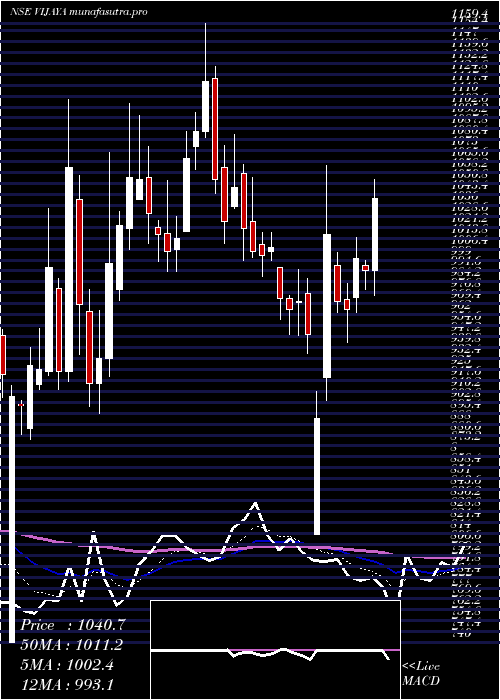
Daily price and volume Vijaya Diagnostic
| Date |
Closing |
Open |
Range |
Volume |
Tue 28 October 2025 |
999.90 (0.03%) |
999.60 |
995.00 - 1005.60 |
0.4804 times |
Mon 27 October 2025 |
999.60 (1.03%) |
999.00 |
989.85 - 1008.00 |
0.5887 times |
Fri 24 October 2025 |
989.40 (-0.14%) |
991.00 |
982.25 - 1000.00 |
0.4604 times |
Thu 23 October 2025 |
990.80 (-0.89%) |
1004.00 |
985.00 - 1004.95 |
1.1869 times |
Tue 21 October 2025 |
999.65 (-0.38%) |
1003.60 |
997.15 - 1008.00 |
0.0564 times |
Mon 20 October 2025 |
1003.50 (1.15%) |
1008.00 |
977.00 - 1008.00 |
0.8069 times |
Fri 17 October 2025 |
992.05 (-1.01%) |
1009.95 |
975.00 - 1009.95 |
1.2418 times |
Thu 16 October 2025 |
1002.20 (1.5%) |
987.40 |
981.55 - 1005.95 |
0.668 times |
Wed 15 October 2025 |
987.40 (1.68%) |
989.00 |
973.20 - 1011.75 |
3.6696 times |
Tue 14 October 2025 |
971.10 (-0.08%) |
971.85 |
960.00 - 977.75 |
0.8408 times |
Mon 13 October 2025 |
971.85 (-0.94%) |
984.95 |
959.90 - 1000.00 |
1.1354 times |
Weekly price and charts VijayaDiagnostic Strong weekly Stock price targets for VijayaDiagnostic VIJAYA are 994.88 and 1013.03 | Weekly Target 1 | 981.1 | | Weekly Target 2 | 990.5 | | Weekly Target 3 | 999.25 | | Weekly Target 4 | 1008.65 | | Weekly Target 5 | 1017.4 |
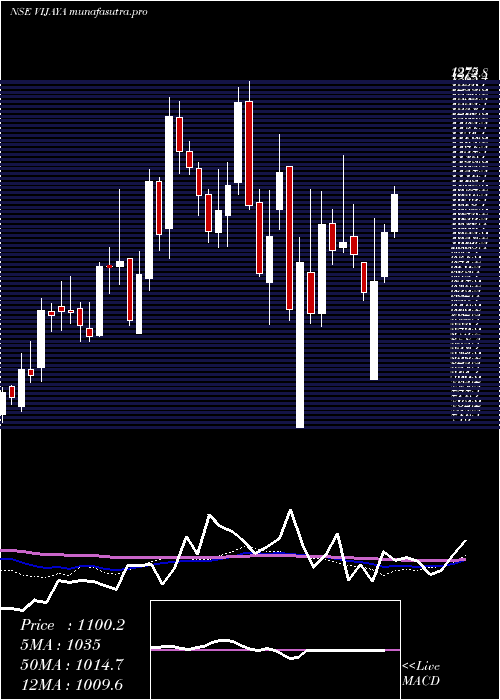
Weekly price and volumes for Vijaya Diagnostic
| Date |
Closing |
Open |
Range |
Volume |
Tue 28 October 2025 |
999.90 (1.06%) |
999.00 |
989.85 - 1008.00 |
0.1466 times |
Fri 24 October 2025 |
989.40 (-0.27%) |
1008.00 |
977.00 - 1008.00 |
0.3443 times |
Fri 17 October 2025 |
992.05 (1.12%) |
984.95 |
959.90 - 1011.75 |
1.0363 times |
Fri 10 October 2025 |
981.05 (-3.03%) |
1014.00 |
971.40 - 1030.00 |
0.608 times |
Fri 03 October 2025 |
1011.70 (-0.8%) |
1020.00 |
990.55 - 1028.00 |
0.9284 times |
Fri 26 September 2025 |
1019.90 (-3.59%) |
1057.00 |
1010.10 - 1065.00 |
1.2682 times |
Fri 19 September 2025 |
1057.90 (1.56%) |
1051.00 |
1036.90 - 1069.80 |
0.5462 times |
Fri 12 September 2025 |
1041.70 (-5.92%) |
1115.00 |
1038.10 - 1120.40 |
1.0925 times |
Fri 05 September 2025 |
1107.20 (9.86%) |
1020.00 |
1008.20 - 1114.90 |
2.2429 times |
Fri 29 August 2025 |
1007.80 (-1.3%) |
1021.10 |
981.00 - 1044.00 |
1.7865 times |
Fri 22 August 2025 |
1021.10 (-3.05%) |
1085.00 |
995.60 - 1085.00 |
2.0496 times |
Monthly price and charts VijayaDiagnostic Strong monthly Stock price targets for VijayaDiagnostic VIJAYA are 944.85 and 1014.95 | Monthly Target 1 | 926.5 | | Monthly Target 2 | 963.2 | | Monthly Target 3 | 996.6 | | Monthly Target 4 | 1033.3 | | Monthly Target 5 | 1066.7 |
Monthly price and volumes Vijaya Diagnostic
| Date |
Closing |
Open |
Range |
Volume |
Tue 28 October 2025 |
999.90 (-0.01%) |
1004.00 |
959.90 - 1030.00 |
0.0939 times |
Tue 30 September 2025 |
1000.00 (-0.77%) |
1020.00 |
995.80 - 1120.40 |
0.2098 times |
Fri 29 August 2025 |
1007.80 (-6.26%) |
1074.80 |
981.00 - 1099.00 |
0.2814 times |
Thu 31 July 2025 |
1075.05 (9.11%) |
989.00 |
971.55 - 1164.70 |
0.8856 times |
Mon 30 June 2025 |
985.25 (3.03%) |
957.00 |
924.55 - 1014.95 |
0.2857 times |
Fri 30 May 2025 |
956.30 (-4.42%) |
1013.00 |
885.00 - 1054.60 |
0.5092 times |
Wed 30 April 2025 |
1000.50 (-0.67%) |
994.00 |
813.15 - 1180.00 |
2.0704 times |
Fri 28 March 2025 |
1007.20 (9.99%) |
915.75 |
895.00 - 1159.40 |
2.8903 times |
Fri 28 February 2025 |
915.75 (-11.5%) |
1076.20 |
740.00 - 1192.00 |
1.6531 times |
Fri 31 January 2025 |
1034.80 (-2.09%) |
1050.00 |
898.50 - 1275.00 |
1.1207 times |
Tue 31 December 2024 |
1056.85 (-9.41%) |
1166.60 |
1018.00 - 1182.05 |
0.4176 times |

DMA SMA EMA moving averages of Vijaya Diagnostic VIJAYA
DMA (daily moving average) of Vijaya Diagnostic VIJAYA
| DMA period | DMA value | | 5 day DMA | 995.87 | | 12 day DMA | 990.71 | | 20 day DMA | 994.73 | | 35 day DMA | 1019.9 | | 50 day DMA | 1026.29 | | 100 day DMA | 1020.17 | | 150 day DMA | 1009.3 | | 200 day DMA | 1018.11 | EMA (exponential moving average) of Vijaya Diagnostic VIJAYA
| EMA period | EMA current | EMA prev | EMA prev2 | | 5 day EMA | 996.65 | 995.02 | 992.73 | | 12 day EMA | 996.36 | 995.72 | 995.01 | | 20 day EMA | 1001.3 | 1001.45 | 1001.65 | | 35 day EMA | 1011.4 | 1012.08 | 1012.82 | | 50 day EMA | 1025.64 | 1026.69 | 1027.8 |
SMA (simple moving average) of Vijaya Diagnostic VIJAYA
| SMA period | SMA current | SMA prev | SMA prev2 | | 5 day SMA | 995.87 | 996.59 | 995.08 | | 12 day SMA | 990.71 | 989.17 | 988.42 | | 20 day SMA | 994.73 | 995.73 | 997.77 | | 35 day SMA | 1019.9 | 1022.96 | 1025.53 | | 50 day SMA | 1026.29 | 1027.45 | 1028.56 | | 100 day SMA | 1020.17 | 1019.82 | 1019.45 | | 150 day SMA | 1009.3 | 1010.1 | 1010.68 | | 200 day SMA | 1018.11 | 1018.74 | 1019.31 |
|
|
