VidhiSpclty VIDHIING full analysis,charts,indicators,moving averages,SMA,DMA,EMA,ADX,MACD,RSIVidhi Spclty VIDHIING WideScreen charts, DMA,SMA,EMA technical analysis, forecast prediction, by indicators ADX,MACD,RSI,CCI NSE stock exchange
Daily price and charts and targets VidhiSpclty Strong Daily Stock price targets for VidhiSpclty VIDHIING are 325.28 and 335.98 | Daily Target 1 | 323.28 | | Daily Target 2 | 327.27 | | Daily Target 3 | 333.98333333333 | | Daily Target 4 | 337.97 | | Daily Target 5 | 344.68 |
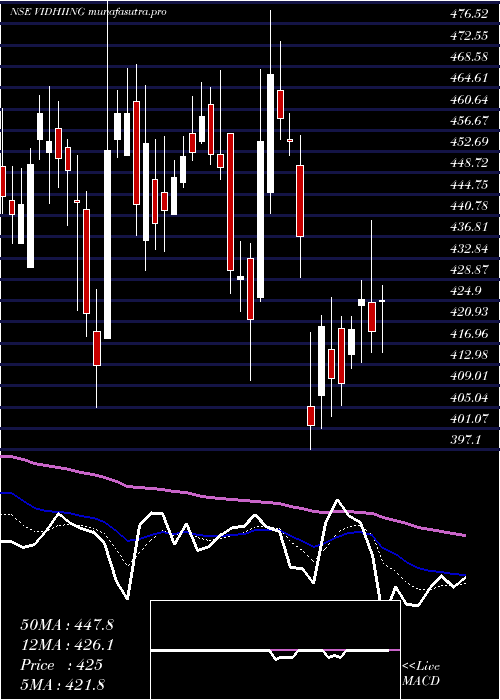
Daily price and volume Vidhi Spclty
| Date |
Closing |
Open |
Range |
Volume |
Tue 28 October 2025 |
331.25 (-1.75%) |
340.70 |
330.00 - 340.70 |
1.1448 times |
Mon 27 October 2025 |
337.15 (-1.99%) |
346.95 |
333.30 - 347.85 |
0.9257 times |
Fri 24 October 2025 |
344.00 (-1.94%) |
354.55 |
343.00 - 354.60 |
0.8991 times |
Thu 23 October 2025 |
350.80 (-2.02%) |
360.05 |
350.00 - 364.85 |
1.4999 times |
Tue 21 October 2025 |
358.05 (-1.12%) |
367.00 |
349.95 - 367.00 |
0.6979 times |
Mon 20 October 2025 |
362.10 (0.77%) |
360.40 |
356.70 - 368.00 |
0.7496 times |
Fri 17 October 2025 |
359.35 (-0.11%) |
361.80 |
351.40 - 366.00 |
1.2872 times |
Thu 16 October 2025 |
359.75 (-0.08%) |
360.40 |
356.70 - 362.20 |
1.1306 times |
Wed 15 October 2025 |
360.05 (0.11%) |
362.00 |
354.40 - 362.00 |
0.8371 times |
Tue 14 October 2025 |
359.65 (-0.9%) |
362.00 |
351.55 - 362.00 |
0.8282 times |
Mon 13 October 2025 |
362.90 (0.06%) |
357.25 |
357.25 - 363.60 |
0.7332 times |
Weekly price and charts VidhiSpclty Strong weekly Stock price targets for VidhiSpclty VIDHIING are 321.7 and 339.55 | Weekly Target 1 | 318.52 | | Weekly Target 2 | 324.88 | | Weekly Target 3 | 336.36666666667 | | Weekly Target 4 | 342.73 | | Weekly Target 5 | 354.22 |
Weekly price and volumes for Vidhi Spclty
| Date |
Closing |
Open |
Range |
Volume |
Tue 28 October 2025 |
331.25 (-3.71%) |
346.95 |
330.00 - 347.85 |
0.4004 times |
Fri 24 October 2025 |
344.00 (-4.27%) |
360.40 |
343.00 - 368.00 |
0.7439 times |
Fri 17 October 2025 |
359.35 (-0.92%) |
357.25 |
351.40 - 366.00 |
0.9314 times |
Fri 10 October 2025 |
362.70 (0.79%) |
362.65 |
338.00 - 367.90 |
1.9642 times |
Fri 03 October 2025 |
359.85 (-0.19%) |
364.40 |
350.00 - 365.40 |
0.5202 times |
Fri 26 September 2025 |
360.55 (-3.93%) |
379.00 |
350.00 - 382.00 |
0.6582 times |
Fri 19 September 2025 |
375.30 (-0.05%) |
380.00 |
369.10 - 383.55 |
0.5649 times |
Fri 12 September 2025 |
375.50 (-2.64%) |
383.80 |
371.10 - 387.90 |
0.6945 times |
Fri 05 September 2025 |
385.70 (1.75%) |
380.00 |
373.35 - 410.00 |
1.7935 times |
Fri 29 August 2025 |
379.05 (2.45%) |
374.10 |
366.00 - 383.95 |
1.7288 times |
Fri 22 August 2025 |
370.00 (-3.85%) |
389.10 |
365.10 - 389.10 |
6.9171 times |

Monthly price and charts VidhiSpclty Strong monthly Stock price targets for VidhiSpclty VIDHIING are 311.63 and 349.63 | Monthly Target 1 | 305.08 | | Monthly Target 2 | 318.17 | | Monthly Target 3 | 343.08333333333 | | Monthly Target 4 | 356.17 | | Monthly Target 5 | 381.08 |
Monthly price and volumes Vidhi Spclty
| Date |
Closing |
Open |
Range |
Volume |
Tue 28 October 2025 |
331.25 (-6.06%) |
356.15 |
330.00 - 368.00 |
0.3541 times |
Tue 30 September 2025 |
352.60 (-6.98%) |
380.00 |
350.00 - 410.00 |
0.3246 times |
Fri 29 August 2025 |
379.05 (-7.56%) |
405.95 |
357.70 - 412.80 |
0.9992 times |
Thu 31 July 2025 |
410.05 (-2.3%) |
423.90 |
391.10 - 437.20 |
1.504 times |
Mon 30 June 2025 |
419.70 (-5.63%) |
445.00 |
404.30 - 447.75 |
0.6724 times |
Fri 30 May 2025 |
444.75 (2.42%) |
428.10 |
403.80 - 460.90 |
0.5605 times |
Wed 30 April 2025 |
434.25 (-4.46%) |
445.00 |
397.10 - 479.00 |
1.8272 times |
Fri 28 March 2025 |
454.50 (2.54%) |
441.95 |
404.95 - 482.95 |
0.9147 times |
Fri 28 February 2025 |
443.25 (-10.32%) |
482.90 |
423.05 - 502.00 |
0.5194 times |
Fri 31 January 2025 |
494.25 (-6.48%) |
533.70 |
425.25 - 565.40 |
2.3238 times |
Tue 31 December 2024 |
528.50 (7.74%) |
483.00 |
469.40 - 569.15 |
2.6929 times |

DMA SMA EMA moving averages of Vidhi Spclty VIDHIING
DMA (daily moving average) of Vidhi Spclty VIDHIING
| DMA period | DMA value | | 5 day DMA | 344.25 | | 12 day DMA | 353.98 | | 20 day DMA | 354 | | 35 day DMA | 362.67 | | 50 day DMA | 367.02 | | 100 day DMA | 388.63 | | 150 day DMA | 404.75 | | 200 day DMA | 421.17 | EMA (exponential moving average) of Vidhi Spclty VIDHIING
| EMA period | EMA current | EMA prev | EMA prev2 | | 5 day EMA | 341.99 | 347.36 | 352.46 | | 12 day EMA | 349.91 | 353.3 | 356.23 | | 20 day EMA | 354.35 | 356.78 | 358.85 | | 35 day EMA | 359.86 | 361.54 | 362.98 | | 50 day EMA | 365.13 | 366.51 | 367.71 |
SMA (simple moving average) of Vidhi Spclty VIDHIING
| SMA period | SMA current | SMA prev | SMA prev2 | | 5 day SMA | 344.25 | 350.42 | 354.86 | | 12 day SMA | 353.98 | 356.36 | 357.4 | | 20 day SMA | 354 | 355.47 | 356.91 | | 35 day SMA | 362.67 | 364.23 | 365.66 | | 50 day SMA | 367.02 | 368.07 | 368.87 | | 100 day SMA | 388.63 | 389.58 | 390.46 | | 150 day SMA | 404.75 | 405.55 | 406.32 | | 200 day SMA | 421.17 | 422.03 | 423.11 |
|
|
