VardhmanHoldings VHL full analysis,charts,indicators,moving averages,SMA,DMA,EMA,ADX,MACD,RSIVardhman Holdings VHL WideScreen charts, DMA,SMA,EMA technical analysis, forecast prediction, by indicators ADX,MACD,RSI,CCI NSE stock exchange
operates under Finance (including NBFCs) sector
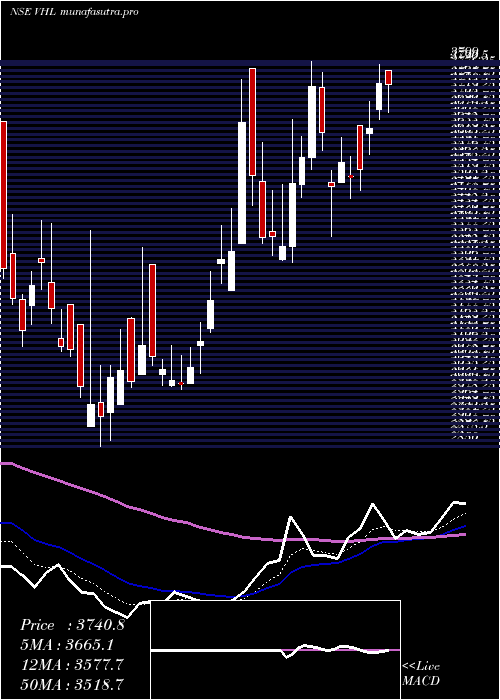
Daily price and charts and targets VardhmanHoldings Strong Daily Stock price targets for VardhmanHoldings VHL are 4058.25 and 4200.95 | Daily Target 1 | 4026.97 | | Daily Target 2 | 4089.53 | | Daily Target 3 | 4169.6666666667 | | Daily Target 4 | 4232.23 | | Daily Target 5 | 4312.37 |
Daily price and volume Vardhman Holdings
| Date |
Closing |
Open |
Range |
Volume |
Tue 28 October 2025 |
4152.10 (-1.32%) |
4185.00 |
4107.10 - 4249.80 |
0.4233 times |
Mon 27 October 2025 |
4207.70 (-0.62%) |
4205.00 |
4150.00 - 4275.00 |
0.9031 times |
Fri 24 October 2025 |
4234.10 (0.22%) |
4202.00 |
4189.60 - 4250.00 |
1.0564 times |
Thu 23 October 2025 |
4224.60 (4.07%) |
4022.00 |
4022.00 - 4258.40 |
2.9452 times |
Tue 21 October 2025 |
4059.20 (-0.54%) |
4081.30 |
3969.20 - 4124.90 |
0.388 times |
Mon 20 October 2025 |
4081.30 (3.98%) |
4000.00 |
3914.30 - 4090.00 |
1.2151 times |
Fri 17 October 2025 |
3925.00 (1.29%) |
3925.00 |
3900.00 - 4140.00 |
2.5644 times |
Thu 16 October 2025 |
3875.20 (1.15%) |
3831.00 |
3831.00 - 3925.00 |
0.279 times |
Wed 15 October 2025 |
3831.10 (0.63%) |
3800.60 |
3800.60 - 3855.90 |
0.0693 times |
Tue 14 October 2025 |
3807.20 (-0.41%) |
3848.80 |
3800.00 - 3870.10 |
0.1562 times |
Mon 13 October 2025 |
3823.00 (-1.84%) |
3875.00 |
3800.00 - 3924.80 |
0.3273 times |
Weekly price and charts VardhmanHoldings Strong weekly Stock price targets for VardhmanHoldings VHL are 4045.65 and 4213.55 | Weekly Target 1 | 4010.17 | | Weekly Target 2 | 4081.13 | | Weekly Target 3 | 4178.0666666667 | | Weekly Target 4 | 4249.03 | | Weekly Target 5 | 4345.97 |
Weekly price and volumes for Vardhman Holdings
| Date |
Closing |
Open |
Range |
Volume |
Tue 28 October 2025 |
4152.10 (-1.94%) |
4205.00 |
4107.10 - 4275.00 |
0.5794 times |
Fri 24 October 2025 |
4234.10 (7.88%) |
4000.00 |
3914.30 - 4258.40 |
2.4483 times |
Fri 17 October 2025 |
3925.00 (0.78%) |
3875.00 |
3800.00 - 4140.00 |
1.4836 times |
Fri 10 October 2025 |
3894.70 (-0.54%) |
3815.50 |
3815.50 - 4030.00 |
0.7508 times |
Fri 03 October 2025 |
3915.80 (3.97%) |
3766.10 |
3766.10 - 3925.00 |
0.8303 times |
Fri 26 September 2025 |
3766.10 (-2.87%) |
3877.50 |
3710.00 - 3915.00 |
0.9541 times |
Fri 19 September 2025 |
3877.50 (-2.35%) |
3970.70 |
3851.00 - 4020.00 |
0.6414 times |
Fri 12 September 2025 |
3970.70 (-1.37%) |
4066.00 |
3970.00 - 4131.70 |
0.6028 times |
Fri 05 September 2025 |
4026.00 (8.38%) |
3700.00 |
3662.00 - 4048.40 |
1.2492 times |
Fri 29 August 2025 |
3714.80 (-2.4%) |
3806.40 |
3700.00 - 3884.90 |
0.4602 times |
Fri 22 August 2025 |
3806.30 (1.08%) |
3899.00 |
3759.40 - 3960.20 |
0.4448 times |

Monthly price and charts VardhmanHoldings Strong monthly Stock price targets for VardhmanHoldings VHL are 3966.2 and 4460.9 | Monthly Target 1 | 3574.43 | | Monthly Target 2 | 3863.27 | | Monthly Target 3 | 4069.1333333333 | | Monthly Target 4 | 4357.97 | | Monthly Target 5 | 4563.83 |
Monthly price and volumes Vardhman Holdings
| Date |
Closing |
Open |
Range |
Volume |
Tue 28 October 2025 |
4152.10 (9.6%) |
3780.30 |
3780.30 - 4275.00 |
0.9201 times |
Tue 30 September 2025 |
3788.50 (1.98%) |
3700.00 |
3662.00 - 4131.70 |
0.6167 times |
Fri 29 August 2025 |
3714.80 (-7.14%) |
3955.00 |
3700.00 - 4075.00 |
0.345 times |
Thu 31 July 2025 |
4000.50 (-2.84%) |
4135.00 |
3990.10 - 4241.90 |
0.6547 times |
Mon 30 June 2025 |
4117.30 (3.62%) |
3991.90 |
3920.10 - 4469.00 |
1.1414 times |
Fri 30 May 2025 |
3973.30 (11.52%) |
3599.90 |
3288.10 - 4150.00 |
1.2809 times |
Wed 30 April 2025 |
3563.00 (6.59%) |
3343.00 |
3304.30 - 3980.00 |
1.0208 times |
Fri 28 March 2025 |
3342.85 (13.2%) |
2957.75 |
2850.00 - 3780.00 |
1.8774 times |
Fri 28 February 2025 |
2953.00 (-20.41%) |
3850.00 |
2899.95 - 3851.95 |
0.9515 times |
Fri 31 January 2025 |
3710.10 (-15.97%) |
4405.05 |
3590.00 - 4595.30 |
1.1914 times |
Tue 31 December 2024 |
4415.05 (-8.36%) |
4817.85 |
4318.80 - 5250.00 |
1.9618 times |
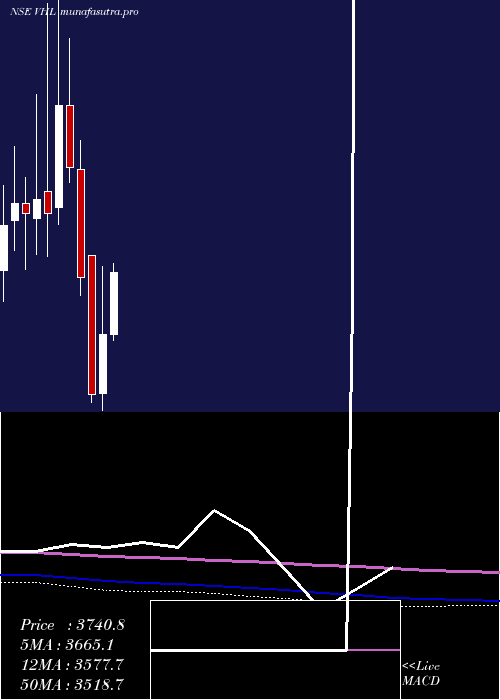
DMA SMA EMA moving averages of Vardhman Holdings VHL
DMA (daily moving average) of Vardhman Holdings VHL
| DMA period | DMA value | | 5 day DMA | 4175.54 | | 12 day DMA | 4009.6 | | 20 day DMA | 3957.83 | | 35 day DMA | 3940.39 | | 50 day DMA | 3906.95 | | 100 day DMA | 3971.97 | | 150 day DMA | 3873.18 | | 200 day DMA | 3784.57 | EMA (exponential moving average) of Vardhman Holdings VHL
| EMA period | EMA current | EMA prev | EMA prev2 | | 5 day EMA | 4150.49 | 4149.68 | 4120.67 | | 12 day EMA | 4060.4 | 4043.73 | 4013.93 | | 20 day EMA | 4004.76 | 3989.26 | 3966.28 | | 35 day EMA | 3954.59 | 3942.96 | 3927.37 | | 50 day EMA | 3926.26 | 3917.05 | 3905.19 |
SMA (simple moving average) of Vardhman Holdings VHL
| SMA period | SMA current | SMA prev | SMA prev2 | | 5 day SMA | 4175.54 | 4161.38 | 4104.84 | | 12 day SMA | 4009.6 | 3989.26 | 3961.73 | | 20 day SMA | 3957.83 | 3938.53 | 3918.77 | | 35 day SMA | 3940.39 | 3936.78 | 3929.99 | | 50 day SMA | 3906.95 | 3900.04 | 3891.98 | | 100 day SMA | 3971.97 | 3970.87 | 3968.91 | | 150 day SMA | 3873.18 | 3866.9 | 3859.58 | | 200 day SMA | 3784.57 | 3784.86 | 3786.47 |
|
|
