VGuard VGUARD full analysis,charts,indicators,moving averages,SMA,DMA,EMA,ADX,MACD,RSIV Guard VGUARD WideScreen charts, DMA,SMA,EMA technical analysis, forecast prediction, by indicators ADX,MACD,RSI,CCI NSE stock exchange
operates under Other Elect.Equip. sector
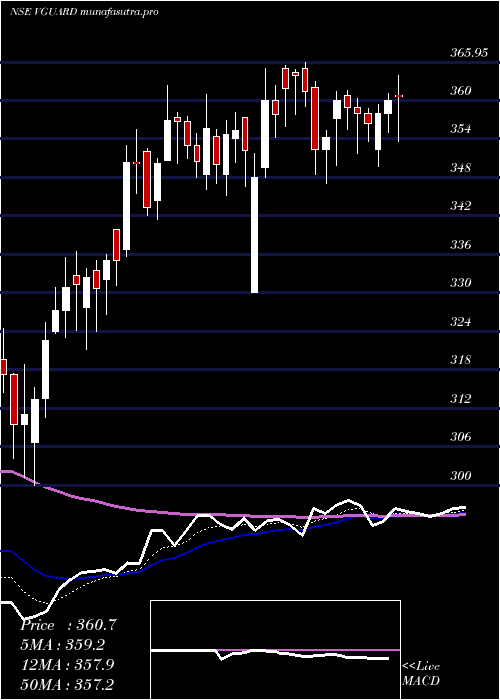
Daily price and charts and targets VGuard Strong Daily Stock price targets for VGuard VGUARD are 375.05 and 382.15 | Daily Target 1 | 369.2 | | Daily Target 2 | 373.8 | | Daily Target 3 | 376.3 | | Daily Target 4 | 380.9 | | Daily Target 5 | 383.4 |
Daily price and volume V Guard
| Date |
Closing |
Open |
Range |
Volume |
Tue 28 October 2025 |
378.40 (0.77%) |
371.70 |
371.70 - 378.80 |
1.0111 times |
Mon 27 October 2025 |
375.50 (0.89%) |
374.90 |
372.95 - 376.70 |
1.7179 times |
Fri 24 October 2025 |
372.20 (0.58%) |
370.00 |
367.05 - 373.50 |
0.9945 times |
Thu 23 October 2025 |
370.05 (1.62%) |
364.15 |
363.15 - 370.75 |
1.6083 times |
Tue 21 October 2025 |
364.15 (-0.22%) |
364.95 |
362.00 - 367.00 |
0.164 times |
Mon 20 October 2025 |
364.95 (0.39%) |
366.35 |
360.95 - 366.35 |
0.7418 times |
Fri 17 October 2025 |
363.55 (0.99%) |
358.00 |
356.25 - 364.50 |
1.0569 times |
Thu 16 October 2025 |
360.00 (1.61%) |
353.50 |
351.60 - 360.40 |
0.9236 times |
Wed 15 October 2025 |
354.30 (0.87%) |
351.30 |
349.75 - 356.50 |
0.7702 times |
Tue 14 October 2025 |
351.25 (-0.52%) |
354.80 |
348.00 - 354.80 |
1.0117 times |
Mon 13 October 2025 |
353.10 (1.36%) |
348.25 |
344.75 - 353.95 |
1.6017 times |
Weekly price and charts VGuard Strong weekly Stock price targets for VGuard VGUARD are 375.05 and 382.15 | Weekly Target 1 | 369.2 | | Weekly Target 2 | 373.8 | | Weekly Target 3 | 376.3 | | Weekly Target 4 | 380.9 | | Weekly Target 5 | 383.4 |
Weekly price and volumes for V Guard
| Date |
Closing |
Open |
Range |
Volume |
Tue 28 October 2025 |
378.40 (1.67%) |
374.90 |
371.70 - 378.80 |
0.2562 times |
Fri 24 October 2025 |
372.20 (2.38%) |
366.35 |
360.95 - 373.50 |
0.3294 times |
Fri 17 October 2025 |
363.55 (4.36%) |
348.25 |
344.75 - 364.50 |
0.5037 times |
Fri 10 October 2025 |
348.35 (-5.16%) |
367.30 |
347.50 - 370.90 |
1.7684 times |
Fri 03 October 2025 |
367.30 (-0.89%) |
370.60 |
362.70 - 377.70 |
0.7545 times |
Fri 26 September 2025 |
370.60 (-1%) |
374.50 |
356.95 - 392.20 |
3.5593 times |
Fri 19 September 2025 |
374.35 (1.24%) |
368.80 |
365.00 - 380.60 |
1.5118 times |
Fri 12 September 2025 |
369.75 (-0.26%) |
370.75 |
360.35 - 375.00 |
0.6564 times |
Fri 05 September 2025 |
370.70 (2.02%) |
363.90 |
355.05 - 371.40 |
0.4279 times |
Fri 29 August 2025 |
363.35 (-2.5%) |
372.85 |
355.55 - 373.55 |
0.2324 times |
Fri 22 August 2025 |
372.65 (3.53%) |
363.00 |
363.00 - 381.55 |
0.9648 times |
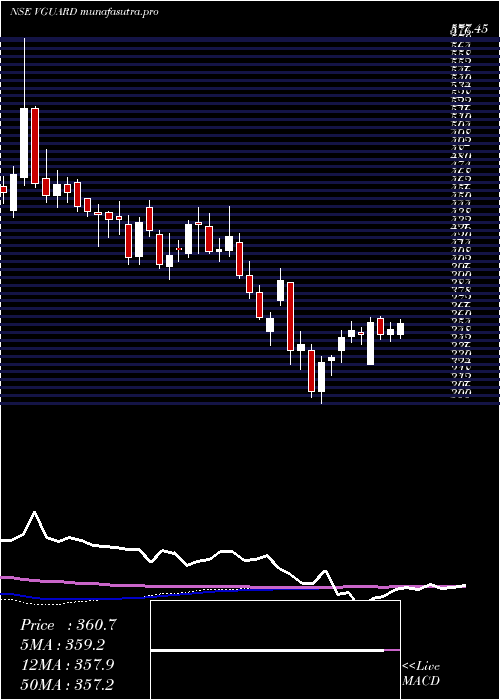
Monthly price and charts VGuard Strong monthly Stock price targets for VGuard VGUARD are 361.58 and 395.63 | Monthly Target 1 | 333.27 | | Monthly Target 2 | 355.83 | | Monthly Target 3 | 367.31666666667 | | Monthly Target 4 | 389.88 | | Monthly Target 5 | 401.37 |
Monthly price and volumes V Guard
| Date |
Closing |
Open |
Range |
Volume |
Tue 28 October 2025 |
378.40 (0.77%) |
375.40 |
344.75 - 378.80 |
0.8062 times |
Tue 30 September 2025 |
375.50 (3.34%) |
363.90 |
355.05 - 392.20 |
1.5576 times |
Fri 29 August 2025 |
363.35 (-4.89%) |
380.15 |
348.55 - 383.50 |
0.4952 times |
Thu 31 July 2025 |
382.05 (-1.36%) |
387.75 |
371.10 - 409.75 |
0.9787 times |
Mon 30 June 2025 |
387.30 (2.1%) |
379.35 |
366.40 - 393.00 |
0.9672 times |
Fri 30 May 2025 |
379.35 (5.19%) |
359.15 |
356.20 - 401.00 |
1.2711 times |
Wed 30 April 2025 |
360.65 (1.43%) |
354.35 |
330.00 - 365.95 |
0.8408 times |
Fri 28 March 2025 |
355.55 (14.9%) |
309.45 |
300.00 - 362.35 |
0.8239 times |
Fri 28 February 2025 |
309.45 (-15.09%) |
378.05 |
304.20 - 402.75 |
1.0312 times |
Fri 31 January 2025 |
364.45 (-13.74%) |
426.50 |
344.05 - 450.00 |
1.2282 times |
Tue 31 December 2024 |
422.50 (1.33%) |
414.50 |
408.40 - 449.50 |
0.8942 times |

DMA SMA EMA moving averages of V Guard VGUARD
DMA (daily moving average) of V Guard VGUARD
| DMA period | DMA value | | 5 day DMA | 372.06 | | 12 day DMA | 362.98 | | 20 day DMA | 363.59 | | 35 day DMA | 366.27 | | 50 day DMA | 366.01 | | 100 day DMA | 374.56 | | 150 day DMA | 371.61 | | 200 day DMA | 368.8 | EMA (exponential moving average) of V Guard VGUARD
| EMA period | EMA current | EMA prev | EMA prev2 | | 5 day EMA | 372.73 | 369.89 | 367.09 | | 12 day EMA | 367.49 | 365.51 | 363.7 | | 20 day EMA | 365.92 | 364.61 | 363.46 | | 35 day EMA | 365.07 | 364.28 | 363.62 | | 50 day EMA | 366.03 | 365.53 | 365.12 |
SMA (simple moving average) of V Guard VGUARD
| SMA period | SMA current | SMA prev | SMA prev2 | | 5 day SMA | 372.06 | 369.37 | 366.98 | | 12 day SMA | 362.98 | 360.65 | 359.05 | | 20 day SMA | 363.59 | 363.2 | 362.92 | | 35 day SMA | 366.27 | 366.05 | 365.76 | | 50 day SMA | 366.01 | 365.6 | 365.28 | | 100 day SMA | 374.56 | 374.51 | 374.5 | | 150 day SMA | 371.61 | 371.42 | 371.26 | | 200 day SMA | 368.8 | 369.01 | 369.27 |
|
|
