VesuviusIndia VESUVIUS full analysis,charts,indicators,moving averages,SMA,DMA,EMA,ADX,MACD,RSIVesuvius India VESUVIUS WideScreen charts, DMA,SMA,EMA technical analysis, forecast prediction, by indicators ADX,MACD,RSI,CCI NSE stock exchange
operates under Other Industrial Goods sector
Daily price and charts and targets VesuviusIndia Strong Daily Stock price targets for VesuviusIndia VESUVIUS are 491.08 and 496.48 | Daily Target 1 | 487.12 | | Daily Target 2 | 489.63 | | Daily Target 3 | 492.51666666667 | | Daily Target 4 | 495.03 | | Daily Target 5 | 497.92 |
Daily price and volume Vesuvius India
| Date |
Closing |
Open |
Range |
Volume |
Wed 29 October 2025 |
492.15 (0.01%) |
492.00 |
490.00 - 495.40 |
0.5866 times |
Tue 28 October 2025 |
492.10 (-0.07%) |
494.00 |
490.10 - 497.00 |
0.5995 times |
Mon 27 October 2025 |
492.45 (0.41%) |
490.00 |
483.95 - 493.50 |
0.9609 times |
Fri 24 October 2025 |
490.45 (1.64%) |
482.10 |
480.45 - 492.50 |
1.9374 times |
Thu 23 October 2025 |
482.55 (-2.09%) |
497.10 |
481.00 - 497.10 |
1.264 times |
Tue 21 October 2025 |
492.85 (2.12%) |
482.60 |
482.60 - 498.30 |
0.3082 times |
Mon 20 October 2025 |
482.60 (0.78%) |
482.00 |
472.85 - 485.00 |
0.991 times |
Fri 17 October 2025 |
478.85 (-3.03%) |
494.00 |
476.55 - 496.95 |
1.2004 times |
Thu 16 October 2025 |
493.80 (0.54%) |
492.00 |
490.00 - 496.00 |
0.3489 times |
Wed 15 October 2025 |
491.15 (1.18%) |
484.65 |
477.05 - 501.00 |
1.803 times |
Tue 14 October 2025 |
485.40 (-3.33%) |
498.00 |
483.25 - 504.90 |
1.3148 times |
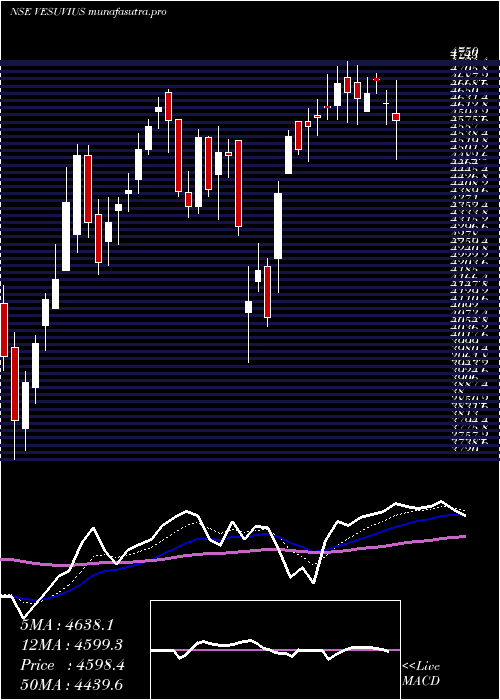
Weekly price and charts VesuviusIndia Strong weekly Stock price targets for VesuviusIndia VESUVIUS are 488.05 and 501.1 | Weekly Target 1 | 477.98 | | Weekly Target 2 | 485.07 | | Weekly Target 3 | 491.03333333333 | | Weekly Target 4 | 498.12 | | Weekly Target 5 | 504.08 |
Weekly price and volumes for Vesuvius India
| Date |
Closing |
Open |
Range |
Volume |
Wed 29 October 2025 |
492.15 (0.35%) |
490.00 |
483.95 - 497.00 |
0.2923 times |
Fri 24 October 2025 |
490.45 (2.42%) |
482.00 |
472.85 - 498.30 |
0.6127 times |
Fri 17 October 2025 |
478.85 (-5.22%) |
500.10 |
476.55 - 505.50 |
0.7171 times |
Fri 10 October 2025 |
505.20 (0.13%) |
502.05 |
500.65 - 521.75 |
0.881 times |
Fri 03 October 2025 |
504.55 (-0.93%) |
510.00 |
496.85 - 516.95 |
0.7519 times |
Fri 26 September 2025 |
509.30 (-4%) |
529.95 |
505.25 - 533.55 |
1.6429 times |
Fri 19 September 2025 |
530.50 (1.47%) |
522.00 |
517.60 - 545.00 |
1.4496 times |
Fri 12 September 2025 |
522.80 (2.13%) |
512.90 |
510.20 - 534.20 |
1.534 times |
Fri 05 September 2025 |
511.90 (1.84%) |
503.95 |
496.30 - 526.40 |
1.2523 times |
Fri 29 August 2025 |
502.65 (-5.36%) |
536.00 |
494.10 - 538.00 |
0.8662 times |
Fri 22 August 2025 |
531.10 (4.4%) |
510.05 |
508.20 - 540.95 |
1.5809 times |
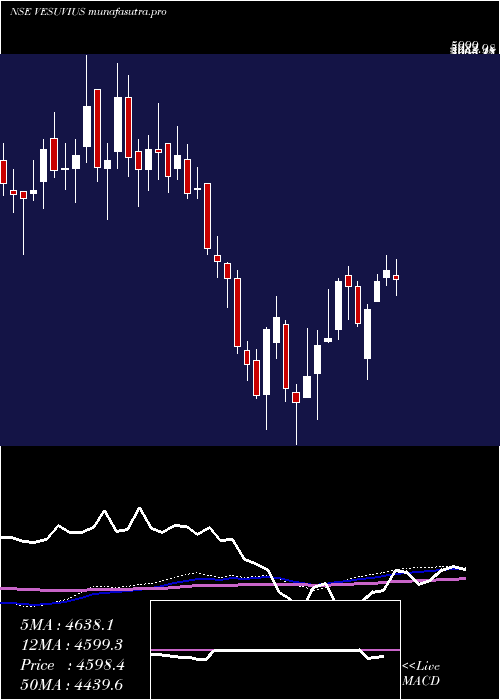
Monthly price and charts VesuviusIndia Strong monthly Stock price targets for VesuviusIndia VESUVIUS are 458.05 and 506.95 | Monthly Target 1 | 446.68 | | Monthly Target 2 | 469.42 | | Monthly Target 3 | 495.58333333333 | | Monthly Target 4 | 518.32 | | Monthly Target 5 | 544.48 |
Monthly price and volumes Vesuvius India
| Date |
Closing |
Open |
Range |
Volume |
Wed 29 October 2025 |
492.15 (-4%) |
516.00 |
472.85 - 521.75 |
1.0807 times |
Tue 30 September 2025 |
512.65 (1.99%) |
503.95 |
496.30 - 545.00 |
2.1997 times |
Fri 29 August 2025 |
502.65 (-2.53%) |
515.70 |
494.10 - 559.90 |
1.8 times |
Thu 31 July 2025 |
515.70 (-6.66%) |
552.50 |
505.05 - 562.05 |
1.611 times |
Mon 30 June 2025 |
552.50 (-90.69%) |
5998.00 |
523.50 - 6188.00 |
2.0823 times |
Fri 30 May 2025 |
5931.40 (27.75%) |
4616.10 |
4496.00 - 6030.00 |
0.2948 times |
Wed 30 April 2025 |
4642.90 (1.94%) |
4554.50 |
3970.05 - 4750.00 |
0.1461 times |
Fri 28 March 2025 |
4554.50 (14.21%) |
4010.00 |
3720.00 - 4680.00 |
0.246 times |
Fri 28 February 2025 |
3987.75 (-6.9%) |
4201.00 |
3561.30 - 4490.00 |
0.3448 times |
Fri 31 January 2025 |
4283.45 (-5.75%) |
4541.00 |
3660.00 - 4653.00 |
0.1946 times |
Tue 31 December 2024 |
4544.80 (-15.43%) |
5351.00 |
4422.35 - 5445.90 |
0.2323 times |
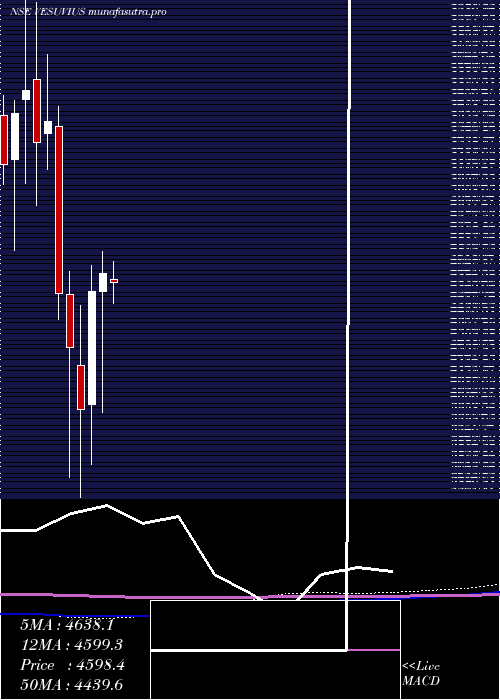
DMA SMA EMA moving averages of Vesuvius India VESUVIUS
DMA (daily moving average) of Vesuvius India VESUVIUS
| DMA period | DMA value | | 5 day DMA | 489.94 | | 12 day DMA | 489.7 | | 20 day DMA | 497.48 | | 35 day DMA | 507.05 | | 50 day DMA | 509.96 | | 100 day DMA | 634.02 | | 150 day DMA | 2070.31 | | 200 day DMA | 2582.44 | EMA (exponential moving average) of Vesuvius India VESUVIUS
| EMA period | EMA current | EMA prev | EMA prev2 | | 5 day EMA | 491 | 490.43 | 489.6 | | 12 day EMA | 492.69 | 492.79 | 492.92 | | 20 day EMA | 496.66 | 497.14 | 497.67 | | 35 day EMA | 502.42 | 503.02 | 503.66 | | 50 day EMA | 508.82 | 509.5 | 510.21 |
SMA (simple moving average) of Vesuvius India VESUVIUS
| SMA period | SMA current | SMA prev | SMA prev2 | | 5 day SMA | 489.94 | 490.08 | 488.18 | | 12 day SMA | 489.7 | 490.79 | 491.75 | | 20 day SMA | 497.48 | 498.3 | 499.16 | | 35 day SMA | 507.05 | 507.73 | 508.29 | | 50 day SMA | 509.96 | 510.29 | 510.89 | | 100 day SMA | 634.02 | 690.39 | 746.05 | | 150 day SMA | 2070.31 | 2097.18 | 2123.35 | | 200 day SMA | 2582.44 | 2602.35 | 2621.83 |
|
|
