VertexplusTechnologies VERTEXPLUS_ST full analysis,charts,indicators,moving averages,SMA,DMA,EMA,ADX,MACD,RSIVertexplus Technologies VERTEXPLUS_ST WideScreen charts, DMA,SMA,EMA technical analysis, forecast prediction, by indicators ADX,MACD,RSI,CCI NSE stock exchange
Daily price and charts and targets VertexplusTechnologies Strong Daily Stock price targets for VertexplusTechnologies VERTEXPLUS_ST are 139 and 145.5 | Daily Target 1 | 133.58 | | Daily Target 2 | 137.92 | | Daily Target 3 | 140.08333333333 | | Daily Target 4 | 144.42 | | Daily Target 5 | 146.58 |
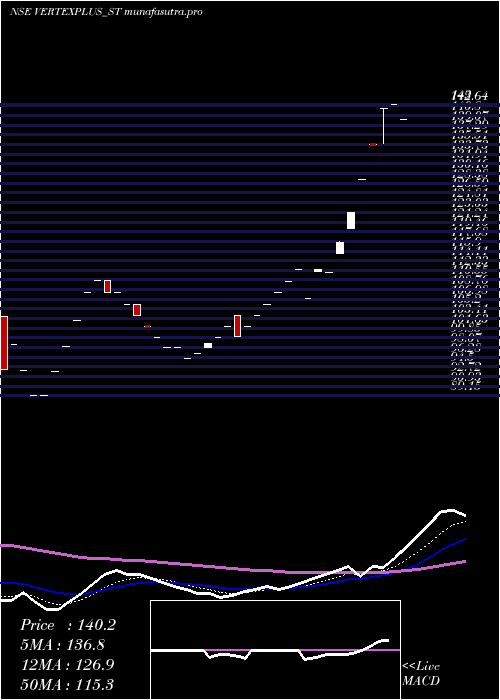
Daily price and volume Vertexplus Technologies
| Date |
Closing |
Open |
Range |
Volume |
Mon 14 July 2025 |
142.25 (4.98%) |
142.25 |
135.75 - 142.25 |
2.1739 times |
Fri 11 July 2025 |
135.50 (4.92%) |
135.60 |
135.50 - 135.60 |
1.7391 times |
Thu 10 July 2025 |
129.15 (5%) |
129.15 |
129.15 - 129.15 |
2.3913 times |
Wed 09 July 2025 |
123.00 (4.68%) |
120.00 |
120.00 - 123.00 |
0.8696 times |
Tue 08 July 2025 |
117.50 (4.91%) |
115.50 |
115.50 - 117.60 |
0.6522 times |
Fri 04 July 2025 |
112.00 (-0.4%) |
112.00 |
112.00 - 112.00 |
0.6522 times |
Wed 02 July 2025 |
112.45 (5%) |
112.05 |
112.05 - 112.45 |
0.6522 times |
Mon 30 June 2025 |
107.10 (-4.84%) |
107.10 |
107.10 - 107.10 |
0.2174 times |
Fri 27 June 2025 |
112.55 (1.99%) |
112.55 |
112.55 - 112.55 |
0.2174 times |
Thu 26 June 2025 |
110.35 (1.99%) |
110.35 |
110.35 - 110.35 |
0.4348 times |
Wed 25 June 2025 |
108.20 (1.98%) |
108.20 |
108.20 - 108.20 |
0.8696 times |
Weekly price and charts VertexplusTechnologies Strong weekly Stock price targets for VertexplusTechnologies VERTEXPLUS_ST are 139 and 145.5 | Weekly Target 1 | 133.58 | | Weekly Target 2 | 137.92 | | Weekly Target 3 | 140.08333333333 | | Weekly Target 4 | 144.42 | | Weekly Target 5 | 146.58 |
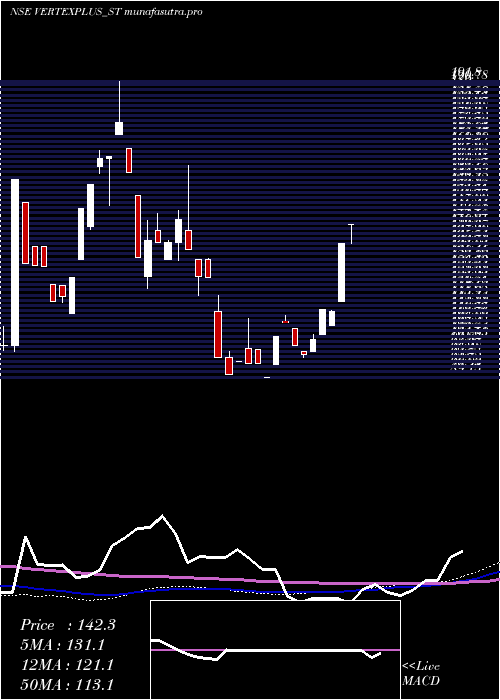
Weekly price and volumes for Vertexplus Technologies
| Date |
Closing |
Open |
Range |
Volume |
Mon 14 July 2025 |
142.25 (4.98%) |
142.25 |
135.75 - 142.25 |
1.0101 times |
Fri 11 July 2025 |
135.50 (20.98%) |
115.50 |
115.50 - 135.60 |
2.6263 times |
Fri 04 July 2025 |
112.00 (-0.49%) |
107.10 |
107.10 - 112.45 |
0.7071 times |
Fri 27 June 2025 |
112.55 (10.29%) |
104.05 |
104.05 - 112.55 |
1.0101 times |
Fri 20 June 2025 |
102.05 (5.21%) |
98.00 |
98.00 - 104.00 |
0.8081 times |
Fri 13 June 2025 |
97.00 (-3%) |
98.00 |
96.05 - 98.00 |
0.7071 times |
Fri 30 May 2025 |
100.00 (-7.62%) |
106.10 |
100.00 - 106.10 |
0.6061 times |
Thu 22 May 2025 |
108.25 (4.94%) |
108.30 |
108.25 - 110.45 |
0.6061 times |
Fri 16 May 2025 |
103.15 (15.7%) |
93.60 |
93.60 - 103.15 |
1.3131 times |
Fri 09 May 2025 |
89.15 (-4.96%) |
89.15 |
89.15 - 89.15 |
0.6061 times |
Fri 02 May 2025 |
93.80 (-0.21%) |
98.70 |
93.80 - 98.70 |
0.202 times |
Monthly price and charts VertexplusTechnologies Strong monthly Stock price targets for VertexplusTechnologies VERTEXPLUS_ST are 127.13 and 157.38 | Monthly Target 1 | 101.92 | | Monthly Target 2 | 122.08 | | Monthly Target 3 | 132.16666666667 | | Monthly Target 4 | 152.33 | | Monthly Target 5 | 162.42 |
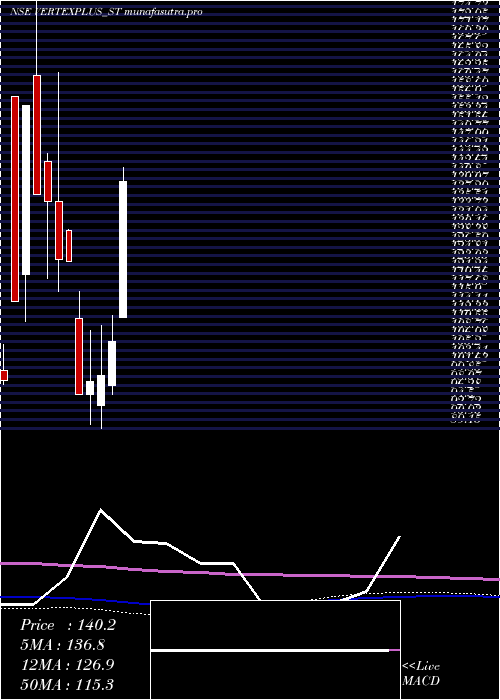
Monthly price and volumes Vertexplus Technologies
| Date |
Closing |
Open |
Range |
Volume |
Mon 14 July 2025 |
142.25 (32.82%) |
112.05 |
112.00 - 142.25 |
0.4839 times |
Mon 30 June 2025 |
107.10 (7.1%) |
98.00 |
96.05 - 112.55 |
0.2995 times |
Fri 30 May 2025 |
100.00 (1.32%) |
93.80 |
89.15 - 110.45 |
0.3687 times |
Mon 28 April 2025 |
98.70 (2.76%) |
96.10 |
90.00 - 109.35 |
0.841 times |
Fri 28 March 2025 |
96.05 (-22.35%) |
111.85 |
96.05 - 117.50 |
4.0438 times |
Thu 03 October 2024 |
123.70 (-0.24%) |
130.00 |
123.70 - 130.20 |
0.0461 times |
Thu 26 September 2024 |
124.00 (-8.82%) |
136.00 |
117.35 - 162.75 |
0.9217 times |
Thu 29 August 2024 |
136.00 (-1.05%) |
144.30 |
120.10 - 146.00 |
1.7742 times |
Wed 31 July 2024 |
137.45 (-11.89%) |
162.25 |
137.45 - 191.80 |
0.818 times |
Thu 27 June 2024 |
156.00 (35.3%) |
121.05 |
111.15 - 156.00 |
0.4032 times |
Fri 31 May 2024 |
115.30 (16.46%) |
157.80 |
115.30 - 157.80 |
0.6912 times |
DMA SMA EMA moving averages of Vertexplus Technologies VERTEXPLUS_ST
DMA (daily moving average) of Vertexplus Technologies VERTEXPLUS_ST
| DMA period | DMA value | | 5 day DMA | 129.48 | | 12 day DMA | 118.01 | | 20 day DMA | 110.81 | | 35 day DMA | 106.65 | | 50 day DMA | 105.7 | | 100 day DMA | 126.79 | | 150 day DMA | | | 200 day DMA | | EMA (exponential moving average) of Vertexplus Technologies VERTEXPLUS_ST
| EMA period | EMA current | EMA prev | EMA prev2 | | 5 day EMA | 131.08 | 125.5 | 120.5 | | 12 day EMA | 121.1 | 117.25 | 113.93 | | 20 day EMA | 115.78 | 112.99 | 110.62 | | 35 day EMA | 112.1 | 110.33 | 108.85 | | 50 day EMA | 110.26 | 108.96 | 107.88 |
SMA (simple moving average) of Vertexplus Technologies VERTEXPLUS_ST
| SMA period | SMA current | SMA prev | SMA prev2 | | 5 day SMA | 129.48 | 123.43 | 118.82 | | 12 day SMA | 118.01 | 114.83 | 112.04 | | 20 day SMA | 110.81 | 108.6 | 106.73 | | 35 day SMA | 106.65 | 105.27 | 104.22 | | 50 day SMA | 105.7 | 105.32 | 105.21 | | 100 day SMA | 126.79 | 126.54 | 126.37 | | 150 day SMA | | 200 day SMA |
|
|
