VertexplusTechnologies VERTEXPLUS_SM full analysis,charts,indicators,moving averages,SMA,DMA,EMA,ADX,MACD,RSIVertexplus Technologies VERTEXPLUS_SM WideScreen charts, DMA,SMA,EMA technical analysis, forecast prediction, by indicators ADX,MACD,RSI,CCI NSE stock exchange
Daily price and charts and targets VertexplusTechnologies Strong Daily Stock price targets for VertexplusTechnologies VERTEXPLUS_SM are 117.85 and 117.95 | Daily Target 1 | 117.83 | | Daily Target 2 | 117.87 | | Daily Target 3 | 117.93333333333 | | Daily Target 4 | 117.97 | | Daily Target 5 | 118.03 |
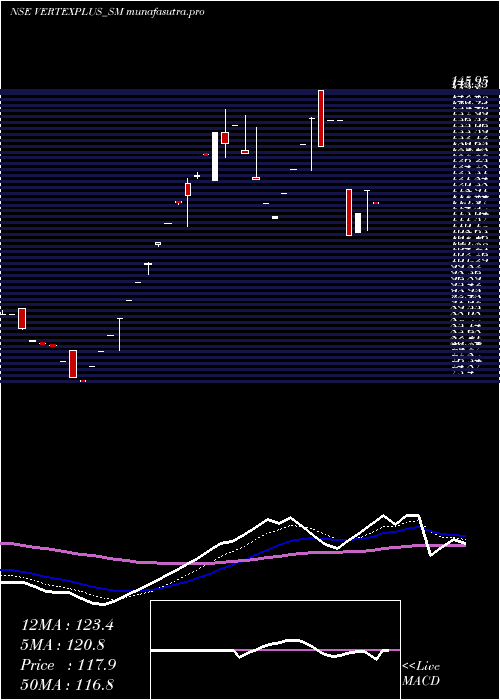
Daily price and volume Vertexplus Technologies
| Date |
Closing |
Open |
Range |
Volume |
Tue 09 December 2025 |
117.90 (-2.56%) |
118.00 |
117.90 - 118.00 |
0.7246 times |
Thu 04 December 2025 |
121.00 (4.99%) |
121.00 |
111.00 - 121.00 |
1.1594 times |
Wed 03 December 2025 |
115.25 (4.96%) |
110.45 |
110.45 - 115.25 |
0.4348 times |
Tue 02 December 2025 |
109.80 (-20.81%) |
121.30 |
109.80 - 121.30 |
0.8696 times |
Wed 17 September 2025 |
138.65 (0%) |
138.65 |
138.65 - 138.65 |
0.4348 times |
Tue 16 September 2025 |
138.65 (5%) |
138.65 |
138.65 - 138.65 |
1.0145 times |
Mon 15 September 2025 |
132.05 (-5%) |
145.95 |
132.05 - 145.95 |
2.6087 times |
Fri 12 September 2025 |
139.00 (4.79%) |
139.00 |
126.05 - 139.25 |
1.8841 times |
Thu 11 September 2025 |
132.65 (4.99%) |
132.65 |
132.65 - 132.65 |
0.5797 times |
Wed 10 September 2025 |
126.35 (4.99%) |
126.35 |
126.35 - 126.35 |
0.2899 times |
Tue 09 September 2025 |
120.35 (4.97%) |
120.35 |
120.35 - 120.35 |
0.1449 times |
Weekly price and charts VertexplusTechnologies Strong weekly Stock price targets for VertexplusTechnologies VERTEXPLUS_SM are 117.85 and 117.95 | Weekly Target 1 | 117.83 | | Weekly Target 2 | 117.87 | | Weekly Target 3 | 117.93333333333 | | Weekly Target 4 | 117.97 | | Weekly Target 5 | 118.03 |
Weekly price and volumes for Vertexplus Technologies
| Date |
Closing |
Open |
Range |
Volume |
Tue 09 December 2025 |
117.90 (-2.56%) |
118.00 |
117.90 - 118.00 |
0.0432 times |
Thu 04 December 2025 |
121.00 (-12.73%) |
121.30 |
109.80 - 121.30 |
0.1469 times |
Wed 17 September 2025 |
138.65 (-0.25%) |
145.95 |
132.05 - 145.95 |
0.242 times |
Fri 12 September 2025 |
139.00 (18.1%) |
114.00 |
114.00 - 139.25 |
0.1901 times |
Mon 24 March 2025 |
117.70 (-5%) |
117.70 |
117.70 - 117.70 |
0.0432 times |
Fri 21 March 2025 |
123.90 (-4.73%) |
123.55 |
123.55 - 141.25 |
4.7969 times |
Thu 13 March 2025 |
130.05 (15.29%) |
118.40 |
112.15 - 130.10 |
0.2506 times |
Fri 07 March 2025 |
112.80 (26.67%) |
93.50 |
93.50 - 112.80 |
2.7571 times |
Fri 28 February 2025 |
89.05 (15.65%) |
80.85 |
80.85 - 89.05 |
0.1901 times |
Fri 21 February 2025 |
77.00 (-6.5%) |
78.25 |
73.40 - 81.00 |
1.3397 times |
Fri 14 February 2025 |
82.35 (-4.85%) |
83.40 |
82.20 - 83.60 |
1.0372 times |

Monthly price and charts VertexplusTechnologies Strong monthly Stock price targets for VertexplusTechnologies VERTEXPLUS_SM are 108.1 and 119.6 | Monthly Target 1 | 104.83 | | Monthly Target 2 | 111.37 | | Monthly Target 3 | 116.33333333333 | | Monthly Target 4 | 122.87 | | Monthly Target 5 | 127.83 |
Monthly price and volumes Vertexplus Technologies
| Date |
Closing |
Open |
Range |
Volume |
Tue 09 December 2025 |
117.90 (-14.97%) |
121.30 |
109.80 - 121.30 |
0.0993 times |
Wed 17 September 2025 |
138.65 (17.8%) |
114.00 |
114.00 - 145.95 |
0.2257 times |
Mon 24 March 2025 |
117.70 (32.17%) |
93.50 |
93.50 - 141.25 |
4.0993 times |
Fri 28 February 2025 |
89.05 (-1.06%) |
91.50 |
73.40 - 91.50 |
2.1174 times |
Fri 31 January 2025 |
90.00 (-10.89%) |
101.00 |
90.00 - 106.00 |
2.6637 times |
Tue 31 December 2024 |
101.00 (-3.58%) |
106.00 |
97.00 - 106.00 |
0.5418 times |
Mon 25 November 2024 |
104.75 (-18.48%) |
122.10 |
104.75 - 122.10 |
0.0226 times |
Tue 22 October 2024 |
128.50 (-22.59%) |
117.55 |
117.55 - 142.80 |
0.0993 times |
Thu 02 May 2024 |
166.00 (0.61%) |
166.00 |
166.00 - 166.00 |
0.0045 times |
Tue 30 April 2024 |
165.00 (16.4%) |
137.00 |
118.35 - 171.50 |
0.1264 times |
Thu 28 March 2024 |
141.75 (-17.23%) |
172.00 |
126.90 - 172.00 |
0.5779 times |

DMA SMA EMA moving averages of Vertexplus Technologies VERTEXPLUS_SM
DMA (daily moving average) of Vertexplus Technologies VERTEXPLUS_SM
| DMA period | DMA value | | 5 day DMA | 120.52 | | 12 day DMA | 125.53 | | 20 day DMA | 126.94 | | 35 day DMA | 112.33 | | 50 day DMA | 107.35 | | 100 day DMA | 118.6 | | 150 day DMA | 142.56 | | 200 day DMA | 152.34 | EMA (exponential moving average) of Vertexplus Technologies VERTEXPLUS_SM
| EMA period | EMA current | EMA prev | EMA prev2 | | 5 day EMA | 120.82 | 122.28 | 122.92 | | 12 day EMA | 123.39 | 124.39 | 125.01 | | 20 day EMA | 121.75 | 122.15 | 122.27 | | 35 day EMA | 116.27 | 116.17 | 115.89 | | 50 day EMA | 108.16 | 107.76 | 107.22 |
SMA (simple moving average) of Vertexplus Technologies VERTEXPLUS_SM
| SMA period | SMA current | SMA prev | SMA prev2 | | 5 day SMA | 120.52 | 124.67 | 126.88 | | 12 day SMA | 125.53 | 125.51 | 125.75 | | 20 day SMA | 126.94 | 127.03 | 126.88 | | 35 day SMA | 112.33 | 111.32 | 110.25 | | 50 day SMA | 107.35 | 107.09 | 106.69 | | 100 day SMA | 118.6 | 119.17 | 119.63 | | 150 day SMA | 142.56 | 143.04 | 143.5 | | 200 day SMA | 152.34 | 152.29 | 152.23 |
|
|
