VerandaLearning VERANDA full analysis,charts,indicators,moving averages,SMA,DMA,EMA,ADX,MACD,RSIVeranda Learning VERANDA WideScreen charts, DMA,SMA,EMA technical analysis, forecast prediction, by indicators ADX,MACD,RSI,CCI NSE stock exchange
Daily price and charts and targets VerandaLearning Strong Daily Stock price targets for VerandaLearning VERANDA are 240.95 and 263.3 | Daily Target 1 | 236.57 | | Daily Target 2 | 245.33 | | Daily Target 3 | 258.91666666667 | | Daily Target 4 | 267.68 | | Daily Target 5 | 281.27 |
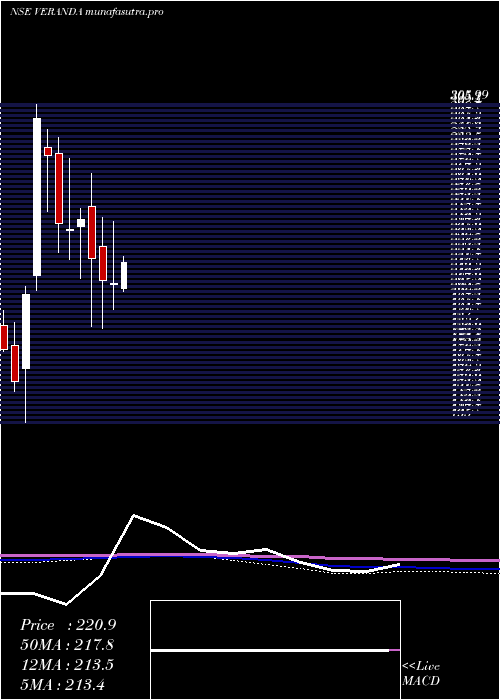
Daily price and volume Veranda Learning
| Date |
Closing |
Open |
Range |
Volume |
Tue 28 October 2025 |
254.10 (-3.18%) |
262.00 |
250.15 - 272.50 |
3.2194 times |
Mon 27 October 2025 |
262.44 (2.94%) |
258.76 |
256.00 - 264.50 |
1.4324 times |
Fri 24 October 2025 |
254.94 (8.13%) |
234.00 |
234.00 - 258.00 |
2.5368 times |
Thu 23 October 2025 |
235.77 (-1.23%) |
239.70 |
234.46 - 243.30 |
0.7732 times |
Tue 21 October 2025 |
238.71 (3.44%) |
233.79 |
231.31 - 241.00 |
0.5174 times |
Mon 20 October 2025 |
230.77 (0.47%) |
229.69 |
227.63 - 234.19 |
0.1596 times |
Fri 17 October 2025 |
229.68 (-0.03%) |
231.45 |
224.99 - 232.59 |
0.4401 times |
Thu 16 October 2025 |
229.76 (2.46%) |
224.25 |
224.25 - 234.90 |
0.291 times |
Wed 15 October 2025 |
224.24 (0.05%) |
223.00 |
222.21 - 227.90 |
0.2886 times |
Tue 14 October 2025 |
224.13 (-1.41%) |
231.48 |
221.15 - 231.48 |
0.3415 times |
Mon 13 October 2025 |
227.33 (2.06%) |
223.86 |
220.07 - 232.00 |
0.5761 times |

Weekly price and charts VerandaLearning Strong weekly Stock price targets for VerandaLearning VERANDA are 240.95 and 263.3 | Weekly Target 1 | 236.57 | | Weekly Target 2 | 245.33 | | Weekly Target 3 | 258.91666666667 | | Weekly Target 4 | 267.68 | | Weekly Target 5 | 281.27 |
Weekly price and volumes for Veranda Learning
| Date |
Closing |
Open |
Range |
Volume |
Tue 28 October 2025 |
254.10 (-0.33%) |
258.76 |
250.15 - 272.50 |
1.2328 times |
Fri 24 October 2025 |
254.94 (11%) |
229.69 |
227.63 - 258.00 |
1.0566 times |
Fri 17 October 2025 |
229.68 (3.12%) |
223.86 |
220.07 - 234.90 |
0.5134 times |
Fri 10 October 2025 |
222.74 (-7.73%) |
242.49 |
221.98 - 244.90 |
0.3017 times |
Fri 03 October 2025 |
241.39 (12.65%) |
216.00 |
211.61 - 243.50 |
0.7682 times |
Fri 26 September 2025 |
214.29 (-2.63%) |
224.90 |
211.51 - 225.75 |
0.6527 times |
Fri 19 September 2025 |
220.07 (-2.84%) |
225.38 |
214.63 - 230.99 |
0.4146 times |
Fri 12 September 2025 |
226.50 (-1.67%) |
232.30 |
223.02 - 235.00 |
0.5022 times |
Fri 05 September 2025 |
230.34 (5.36%) |
221.47 |
206.00 - 233.50 |
0.8953 times |
Fri 29 August 2025 |
218.63 (-1.28%) |
221.90 |
217.25 - 239.40 |
3.6625 times |
Fri 22 August 2025 |
221.47 (-1.32%) |
225.49 |
220.00 - 236.58 |
0.3044 times |

Monthly price and charts VerandaLearning Strong monthly Stock price targets for VerandaLearning VERANDA are 235.46 and 291.14 | Monthly Target 1 | 192.13 | | Monthly Target 2 | 223.11 | | Monthly Target 3 | 247.80666666667 | | Monthly Target 4 | 278.79 | | Monthly Target 5 | 303.49 |
Monthly price and volumes Veranda Learning
| Date |
Closing |
Open |
Range |
Volume |
Tue 28 October 2025 |
254.10 (16.33%) |
217.55 |
216.82 - 272.50 |
1.5244 times |
Tue 30 September 2025 |
218.43 (-0.09%) |
221.47 |
206.00 - 235.00 |
1.0687 times |
Fri 29 August 2025 |
218.63 (-7.88%) |
240.00 |
217.25 - 249.50 |
2.2076 times |
Thu 31 July 2025 |
237.32 (19.56%) |
199.40 |
194.50 - 271.00 |
2.4091 times |
Mon 30 June 2025 |
198.50 (-3.62%) |
206.00 |
189.92 - 212.00 |
0.3407 times |
Fri 30 May 2025 |
205.95 (-1.75%) |
207.10 |
204.43 - 228.00 |
0.2572 times |
Wed 30 April 2025 |
209.62 (-0.87%) |
208.90 |
195.51 - 242.84 |
0.4636 times |
Fri 28 March 2025 |
211.47 (-5.25%) |
229.66 |
185.30 - 245.00 |
0.85 times |
Fri 28 February 2025 |
223.19 (-8.59%) |
250.95 |
186.54 - 269.01 |
0.5073 times |
Fri 31 January 2025 |
244.17 (2.33%) |
240.00 |
212.30 - 250.00 |
0.3715 times |
Tue 31 December 2024 |
238.60 (-1.32%) |
238.30 |
222.72 - 277.00 |
0.5064 times |
DMA SMA EMA moving averages of Veranda Learning VERANDA
DMA (daily moving average) of Veranda Learning VERANDA
| DMA period | DMA value | | 5 day DMA | 249.19 | | 12 day DMA | 236.22 | | 20 day DMA | 232.06 | | 35 day DMA | 228.05 | | 50 day DMA | 226.75 | | 100 day DMA | 224.37 | | 150 day DMA | 219.73 | | 200 day DMA | 222.56 | EMA (exponential moving average) of Veranda Learning VERANDA
| EMA period | EMA current | EMA prev | EMA prev2 | | 5 day EMA | 249.89 | 247.79 | 240.47 | | 12 day EMA | 240.49 | 238.02 | 233.58 | | 20 day EMA | 235.46 | 233.5 | 230.45 | | 35 day EMA | 231.72 | 230.4 | 228.51 | | 50 day EMA | 229.4 | 228.39 | 227 |
SMA (simple moving average) of Veranda Learning VERANDA
| SMA period | SMA current | SMA prev | SMA prev2 | | 5 day SMA | 249.19 | 244.53 | 237.97 | | 12 day SMA | 236.22 | 233.71 | 230.59 | | 20 day SMA | 232.06 | 230.07 | 227.62 | | 35 day SMA | 228.05 | 227.37 | 225.95 | | 50 day SMA | 226.75 | 226.28 | 225.67 | | 100 day SMA | 224.37 | 223.84 | 223.2 | | 150 day SMA | 219.73 | 219.46 | 219.08 | | 200 day SMA | 222.56 | 222.46 | 222.36 |
|
|
