VenusRemedies VENUSREM_BE full analysis,charts,indicators,moving averages,SMA,DMA,EMA,ADX,MACD,RSIVenus Remedies VENUSREM_BE WideScreen charts, DMA,SMA,EMA technical analysis, forecast prediction, by indicators ADX,MACD,RSI,CCI NSE stock exchange
Daily price and charts and targets VenusRemedies Strong Daily Stock price targets for VenusRemedies VENUSREM_BE are 772.93 and 818.83 | Daily Target 1 | 734.68 | | Daily Target 2 | 765.27 | | Daily Target 3 | 780.58333333333 | | Daily Target 4 | 811.17 | | Daily Target 5 | 826.48 |
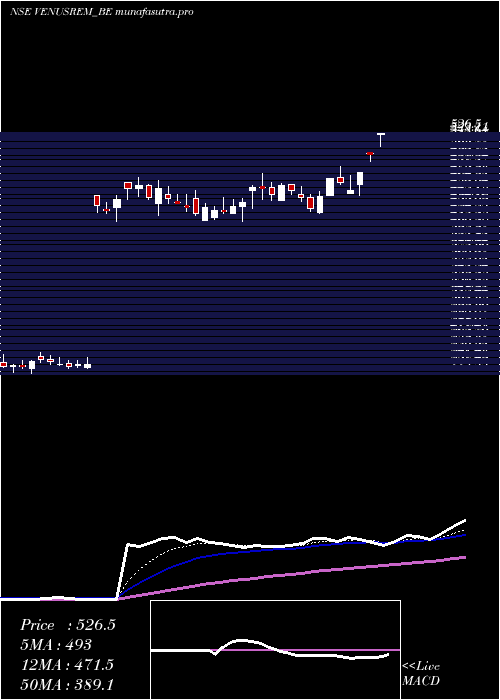
Daily price and volume Venus Remedies
| Date |
Closing |
Open |
Range |
Volume |
Wed 10 December 2025 |
795.85 (4.99%) |
750.00 |
750.00 - 795.90 |
1.1803 times |
Tue 09 December 2025 |
758.00 (-0.64%) |
760.00 |
724.80 - 760.00 |
0.816 times |
Mon 08 December 2025 |
762.90 (2.4%) |
747.90 |
730.75 - 780.00 |
1.2297 times |
Fri 05 December 2025 |
745.05 (-2.5%) |
764.15 |
726.00 - 766.00 |
0.887 times |
Thu 04 December 2025 |
764.15 (-0.89%) |
779.00 |
732.50 - 779.00 |
1.1756 times |
Wed 03 December 2025 |
771.05 (1.02%) |
763.00 |
756.80 - 799.80 |
1.9659 times |
Tue 02 December 2025 |
763.30 (64.31%) |
729.90 |
728.90 - 763.40 |
2.1994 times |
Mon 08 September 2025 |
464.55 (1.13%) |
453.05 |
450.20 - 467.90 |
0.3194 times |
Fri 05 September 2025 |
459.35 (-0.96%) |
475.00 |
457.05 - 475.00 |
0.1115 times |
Thu 04 September 2025 |
463.80 (-0.93%) |
470.00 |
460.00 - 482.65 |
0.1152 times |
Wed 03 September 2025 |
468.15 (1.17%) |
452.70 |
452.70 - 476.00 |
0.0907 times |
Weekly price and charts VenusRemedies Strong weekly Stock price targets for VenusRemedies VENUSREM_BE are 760.33 and 831.43 | Weekly Target 1 | 701.08 | | Weekly Target 2 | 748.47 | | Weekly Target 3 | 772.18333333333 | | Weekly Target 4 | 819.57 | | Weekly Target 5 | 843.28 |
Weekly price and volumes for Venus Remedies
| Date |
Closing |
Open |
Range |
Volume |
Wed 10 December 2025 |
795.85 (6.82%) |
747.90 |
724.80 - 795.90 |
1.1816 times |
Fri 05 December 2025 |
745.05 (62.2%) |
453.05 |
450.20 - 799.80 |
2.3981 times |
Fri 05 September 2025 |
459.35 (0.75%) |
436.00 |
435.00 - 482.65 |
0.2662 times |
Fri 29 August 2025 |
455.95 (-10.6%) |
520.00 |
448.00 - 531.75 |
0.4326 times |
Fri 22 August 2025 |
510.00 (7.65%) |
464.40 |
464.40 - 512.00 |
0.4324 times |
Thu 14 August 2025 |
473.75 (-1.36%) |
480.30 |
471.15 - 483.40 |
0.2675 times |
Fri 08 August 2025 |
480.30 (-9.38%) |
519.40 |
480.30 - 519.40 |
0.3231 times |
Fri 01 August 2025 |
530.00 (2.12%) |
529.00 |
508.65 - 542.70 |
0.5558 times |
Fri 25 July 2025 |
519.00 (-6.08%) |
541.55 |
499.55 - 541.55 |
0.5892 times |
Fri 18 July 2025 |
552.60 (21.44%) |
461.85 |
447.80 - 567.80 |
3.5536 times |
Fri 11 July 2025 |
455.05 (2.19%) |
445.30 |
426.00 - 485.00 |
1.3086 times |

Monthly price and charts VenusRemedies Strong monthly Stock price targets for VenusRemedies VENUSREM_BE are 760.33 and 835.33 | Monthly Target 1 | 698.48 | | Monthly Target 2 | 747.17 | | Monthly Target 3 | 773.48333333333 | | Monthly Target 4 | 822.17 | | Monthly Target 5 | 848.48 |
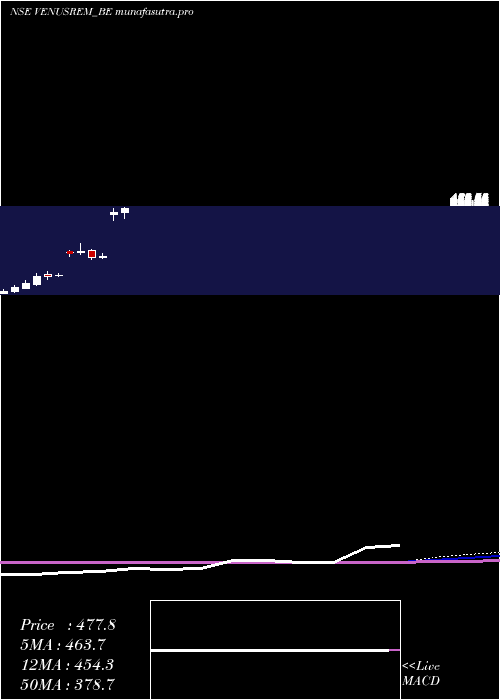
Monthly price and volumes Venus Remedies
| Date |
Closing |
Open |
Range |
Volume |
Wed 10 December 2025 |
795.85 (71.32%) |
729.90 |
724.80 - 799.80 |
1.2473 times |
Mon 08 September 2025 |
464.55 (1.89%) |
436.00 |
435.00 - 482.65 |
0.138 times |
Fri 29 August 2025 |
455.95 (-14.31%) |
535.90 |
448.00 - 542.70 |
0.5812 times |
Thu 31 July 2025 |
532.10 (16.07%) |
458.45 |
426.00 - 567.80 |
2.4067 times |
Mon 30 June 2025 |
458.45 (95.67%) |
447.80 |
415.40 - 475.50 |
1.4665 times |
Fri 22 September 2023 |
234.30 (1.23%) |
231.00 |
223.55 - 249.90 |
0.6075 times |
Thu 31 August 2023 |
231.45 (-10.65%) |
264.20 |
222.00 - 272.00 |
1.1125 times |
Mon 31 July 2023 |
259.05 (1.89%) |
254.25 |
245.00 - 300.00 |
1.0893 times |
Fri 30 June 2023 |
254.25 (79.94%) |
254.70 |
235.00 - 266.00 |
0.77 times |
Mon 09 November 2020 |
141.30 (5.25%) |
140.95 |
135.60 - 149.45 |
0.581 times |
Fri 30 October 2020 |
134.25 (-1.65%) |
143.30 |
121.20 - 157.95 |
1.3554 times |
DMA SMA EMA moving averages of Venus Remedies VENUSREM_BE
DMA (daily moving average) of Venus Remedies VENUSREM_BE
| DMA period | DMA value | | 5 day DMA | 765.19 | | 12 day DMA | 639.91 | | 20 day DMA | 576.41 | | 35 day DMA | 542.88 | | 50 day DMA | 531.79 | | 100 day DMA | 432.33 | | 150 day DMA | 360.47 | | 200 day DMA | 299.67 | EMA (exponential moving average) of Venus Remedies VENUSREM_BE
| EMA period | EMA current | EMA prev | EMA prev2 | | 5 day EMA | 753.97 | 733.03 | 720.55 | | 12 day EMA | 675.3 | 653.39 | 634.38 | | 20 day EMA | 622.29 | 604.03 | 587.83 | | 35 day EMA | 576.14 | 563.21 | 551.74 | | 50 day EMA | 548.28 | 538.18 | 529.21 |
SMA (simple moving average) of Venus Remedies VENUSREM_BE
| SMA period | SMA current | SMA prev | SMA prev2 | | 5 day SMA | 765.19 | 760.23 | 761.29 | | 12 day SMA | 639.91 | 611.51 | 586.34 | | 20 day SMA | 576.41 | 560.82 | 547.08 | | 35 day SMA | 542.88 | 534.97 | 528.14 | | 50 day SMA | 531.79 | 524.52 | 518.26 | | 100 day SMA | 432.33 | 427.08 | 422.21 | | 150 day SMA | 360.47 | 356.06 | 351.93 | | 200 day SMA | 299.67 | 296.11 | 292.73 |
|
|
