VeekayemFash VEEKAYEM_SM full analysis,charts,indicators,moving averages,SMA,DMA,EMA,ADX,MACD,RSIVeekayem Fash VEEKAYEM_SM WideScreen charts, DMA,SMA,EMA technical analysis, forecast prediction, by indicators ADX,MACD,RSI,CCI NSE stock exchange
Daily price and charts and targets VeekayemFash Strong Daily Stock price targets for VeekayemFash VEEKAYEM_SM are 203.5 and 234.5 | Daily Target 1 | 178.33 | | Daily Target 2 | 197.67 | | Daily Target 3 | 209.33333333333 | | Daily Target 4 | 228.67 | | Daily Target 5 | 240.33 |
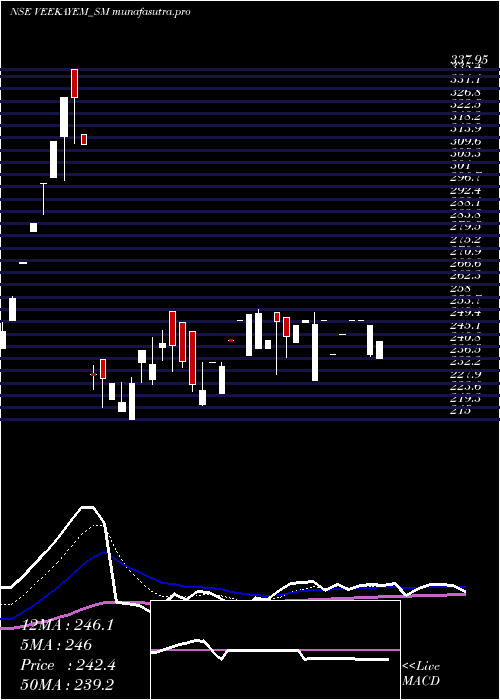
Daily price and volume Veekayem Fash
| Date |
Closing |
Open |
Range |
Volume |
Tue 09 December 2025 |
217.00 (7.61%) |
193.00 |
190.00 - 221.00 |
0.3301 times |
Mon 08 December 2025 |
201.65 (-9.39%) |
219.95 |
199.50 - 219.95 |
0.2136 times |
Fri 05 December 2025 |
222.55 (-6.84%) |
217.25 |
213.35 - 224.95 |
0.3301 times |
Thu 04 December 2025 |
238.90 (-4.11%) |
249.00 |
235.00 - 250.00 |
1.2233 times |
Wed 03 December 2025 |
249.15 (-3.26%) |
255.00 |
236.00 - 255.00 |
0.9126 times |
Tue 02 December 2025 |
257.55 (0.27%) |
249.00 |
237.00 - 282.50 |
1.767 times |
Mon 01 December 2025 |
256.85 (4.3%) |
248.00 |
248.00 - 258.00 |
0.4078 times |
Fri 28 November 2025 |
246.25 (7%) |
222.50 |
222.50 - 253.15 |
2 times |
Thu 27 November 2025 |
230.15 (2.81%) |
226.95 |
215.05 - 230.50 |
0.8155 times |
Wed 26 November 2025 |
223.85 (-0.6%) |
216.00 |
215.00 - 230.00 |
2 times |
Tue 25 November 2025 |
225.20 (-2.07%) |
230.00 |
218.15 - 230.00 |
0.3107 times |
Weekly price and charts VeekayemFash Strong weekly Stock price targets for VeekayemFash VEEKAYEM_SM are 188 and 219 | Weekly Target 1 | 178.33 | | Weekly Target 2 | 197.67 | | Weekly Target 3 | 209.33333333333 | | Weekly Target 4 | 228.67 | | Weekly Target 5 | 240.33 |
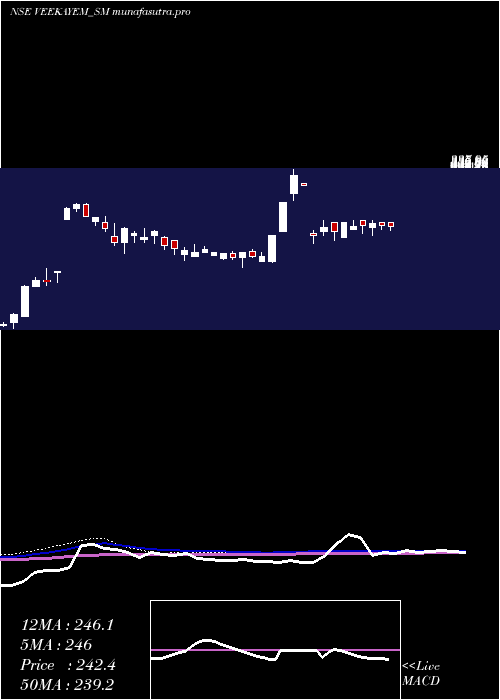
Weekly price and volumes for Veekayem Fash
| Date |
Closing |
Open |
Range |
Volume |
Tue 09 December 2025 |
217.00 (-2.49%) |
219.95 |
190.00 - 221.00 |
0.3694 times |
Fri 05 December 2025 |
222.55 (-9.62%) |
248.00 |
213.35 - 282.50 |
3.153 times |
Fri 28 November 2025 |
246.25 (6.6%) |
229.85 |
215.00 - 253.15 |
4.1029 times |
Fri 21 November 2025 |
231.00 (-3.71%) |
231.00 |
231.00 - 231.00 |
0.0264 times |
Mon 10 November 2025 |
239.90 (-8.44%) |
236.40 |
235.80 - 250.00 |
0.1187 times |
Thu 06 November 2025 |
262.00 (-8.74%) |
260.05 |
258.40 - 262.00 |
0.1055 times |
Thu 30 October 2025 |
287.10 (-4.93%) |
273.00 |
273.00 - 289.90 |
0.2507 times |
Thu 23 October 2025 |
302.00 (1%) |
297.00 |
290.00 - 302.00 |
0.3694 times |
Fri 17 October 2025 |
299.00 (7.75%) |
274.95 |
248.25 - 300.20 |
1.438 times |
Fri 10 October 2025 |
277.50 (-0.88%) |
274.95 |
248.70 - 277.50 |
0.066 times |
Fri 03 October 2025 |
279.95 (-0.44%) |
267.40 |
267.30 - 288.85 |
0.3958 times |
Monthly price and charts VeekayemFash Strong monthly Stock price targets for VeekayemFash VEEKAYEM_SM are 157.25 and 249.75 | Monthly Target 1 | 137.33 | | Monthly Target 2 | 177.17 | | Monthly Target 3 | 229.83333333333 | | Monthly Target 4 | 269.67 | | Monthly Target 5 | 322.33 |
Monthly price and volumes Veekayem Fash
| Date |
Closing |
Open |
Range |
Volume |
Tue 09 December 2025 |
217.00 (-11.88%) |
248.00 |
190.00 - 282.50 |
1.227 times |
Fri 28 November 2025 |
246.25 (-14.23%) |
260.05 |
215.00 - 262.00 |
1.5165 times |
Thu 30 October 2025 |
287.10 (-0.61%) |
275.70 |
248.25 - 302.00 |
0.8134 times |
Tue 30 September 2025 |
288.85 (-4.35%) |
303.50 |
267.30 - 318.00 |
1.3235 times |
Fri 29 August 2025 |
302.00 (25.94%) |
244.00 |
220.90 - 302.00 |
0.6066 times |
Thu 31 July 2025 |
239.80 (-0.56%) |
230.00 |
228.80 - 252.20 |
0.6756 times |
Thu 26 June 2025 |
241.15 (-12.31%) |
262.00 |
236.55 - 265.50 |
1.1443 times |
Fri 30 May 2025 |
275.00 (15.55%) |
245.00 |
233.55 - 275.00 |
1.3281 times |
Wed 30 April 2025 |
238.00 (1.3%) |
224.35 |
224.35 - 253.80 |
0.3355 times |
Fri 28 March 2025 |
234.95 (-24.6%) |
231.00 |
215.00 - 253.00 |
1.0294 times |
Mon 07 October 2024 |
311.60 (4.58%) |
300.00 |
299.00 - 337.95 |
0.4412 times |
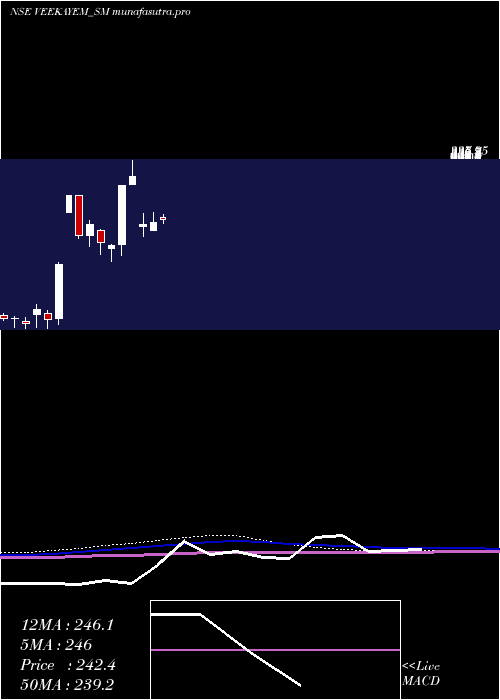
DMA SMA EMA moving averages of Veekayem Fash VEEKAYEM_SM
DMA (daily moving average) of Veekayem Fash VEEKAYEM_SM
| DMA period | DMA value | | 5 day DMA | 225.85 | | 12 day DMA | 233.25 | | 20 day DMA | 244.56 | | 35 day DMA | 261.25 | | 50 day DMA | 274.79 | | 100 day DMA | 264.49 | | 150 day DMA | 259.45 | | 200 day DMA | 245.3 | EMA (exponential moving average) of Veekayem Fash VEEKAYEM_SM
| EMA period | EMA current | EMA prev | EMA prev2 | | 5 day EMA | 222.75 | 225.62 | 237.61 | | 12 day EMA | 233.92 | 237 | 243.43 | | 20 day EMA | 243.21 | 245.97 | 250.63 | | 35 day EMA | 256.51 | 258.84 | 262.21 | | 50 day EMA | 270.41 | 272.59 | 275.48 |
SMA (simple moving average) of Veekayem Fash VEEKAYEM_SM
| SMA period | SMA current | SMA prev | SMA prev2 | | 5 day SMA | 225.85 | 233.96 | 245 | | 12 day SMA | 233.25 | 234.42 | 236.87 | | 20 day SMA | 244.56 | 248.56 | 253.43 | | 35 day SMA | 261.25 | 263.31 | 266 | | 50 day SMA | 274.79 | 276.25 | 277.97 | | 100 day SMA | 264.49 | 264.91 | 265.43 | | 150 day SMA | 259.45 | 259.31 | 259.23 | | 200 day SMA | 245.3 | 245.34 | 245.47 |
|
|
