VaswaniInd VASWANI_BE full analysis,charts,indicators,moving averages,SMA,DMA,EMA,ADX,MACD,RSIVaswani Ind VASWANI_BE WideScreen charts, DMA,SMA,EMA technical analysis, forecast prediction, by indicators ADX,MACD,RSI,CCI NSE stock exchange
Daily price and charts and targets VaswaniInd Strong Daily Stock price targets for VaswaniInd VASWANI_BE are 56.2 and 59.15 | Daily Target 1 | 53.85 | | Daily Target 2 | 55.59 | | Daily Target 3 | 56.796666666667 | | Daily Target 4 | 58.54 | | Daily Target 5 | 59.75 |
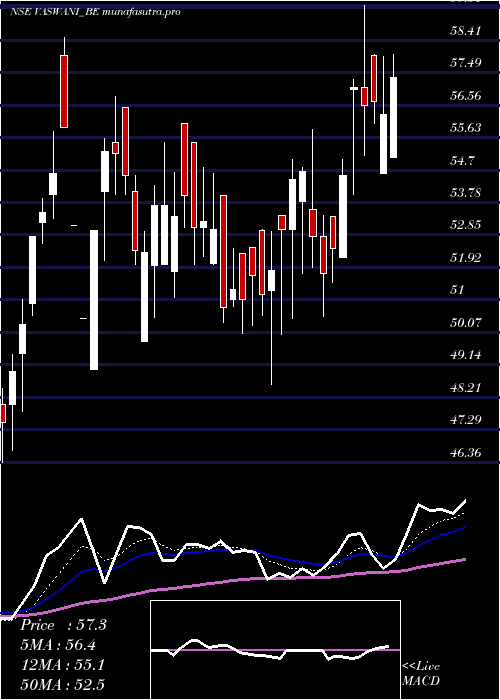
Daily price and volume Vaswani Ind
| Date |
Closing |
Open |
Range |
Volume |
Wed 03 September 2025 |
57.34 (1.87%) |
55.05 |
55.05 - 58.00 |
0.8322 times |
Tue 02 September 2025 |
56.29 (-0.64%) |
54.60 |
54.60 - 57.95 |
0.3192 times |
Mon 01 September 2025 |
56.65 (0.19%) |
57.99 |
56.05 - 58.00 |
0.3499 times |
Fri 29 August 2025 |
56.54 (-0.93%) |
57.07 |
55.11 - 59.40 |
0.8222 times |
Thu 28 August 2025 |
57.07 (4.6%) |
57.00 |
54.02 - 57.28 |
2.1369 times |
Tue 26 August 2025 |
54.56 (4%) |
52.20 |
52.20 - 55.00 |
1.1593 times |
Mon 25 August 2025 |
52.46 (1.37%) |
53.39 |
51.50 - 53.39 |
0.441 times |
Fri 22 August 2025 |
51.75 (-2.01%) |
52.81 |
50.52 - 53.40 |
0.5306 times |
Thu 21 August 2025 |
52.81 (-3.38%) |
53.57 |
51.92 - 55.87 |
2.693 times |
Wed 20 August 2025 |
54.66 (0.42%) |
53.80 |
51.75 - 54.79 |
0.7157 times |
Tue 19 August 2025 |
54.43 (2.7%) |
53.00 |
50.45 - 55.00 |
0.9382 times |
Weekly price and charts VaswaniInd Strong weekly Stock price targets for VaswaniInd VASWANI_BE are 54.27 and 57.67 | Weekly Target 1 | 53.25 | | Weekly Target 2 | 55.29 | | Weekly Target 3 | 56.646666666667 | | Weekly Target 4 | 58.69 | | Weekly Target 5 | 60.05 |
Weekly price and volumes for Vaswani Ind
| Date |
Closing |
Open |
Range |
Volume |
Wed 03 September 2025 |
57.34 (1.41%) |
57.99 |
54.60 - 58.00 |
0.4344 times |
Fri 29 August 2025 |
56.54 (9.26%) |
53.39 |
51.50 - 59.40 |
1.3193 times |
Fri 22 August 2025 |
51.75 (-0.17%) |
53.40 |
50.00 - 55.87 |
1.7313 times |
Thu 14 August 2025 |
51.84 (1.05%) |
52.33 |
48.58 - 53.00 |
0.6056 times |
Fri 08 August 2025 |
51.30 (-4.96%) |
55.49 |
50.35 - 55.49 |
0.7303 times |
Fri 01 August 2025 |
53.98 (3.02%) |
49.80 |
49.80 - 56.05 |
0.9087 times |
Fri 25 July 2025 |
52.40 (3.87%) |
49.00 |
49.00 - 56.80 |
1.5542 times |
Fri 18 July 2025 |
50.45 (-7.62%) |
57.99 |
50.45 - 58.50 |
0.5477 times |
Fri 03 January 2025 |
54.61 (14.97%) |
48.00 |
46.70 - 55.81 |
1.401 times |
Fri 27 December 2024 |
47.50 (-0.11%) |
47.50 |
46.00 - 48.80 |
0.7674 times |
Fri 20 December 2024 |
47.55 (-3%) |
48.15 |
46.05 - 50.00 |
0.6853 times |

Monthly price and charts VaswaniInd Strong monthly Stock price targets for VaswaniInd VASWANI_BE are 54.27 and 57.67 | Monthly Target 1 | 53.25 | | Monthly Target 2 | 55.29 | | Monthly Target 3 | 56.646666666667 | | Monthly Target 4 | 58.69 | | Monthly Target 5 | 60.05 |
Monthly price and volumes Vaswani Ind
| Date |
Closing |
Open |
Range |
Volume |
Wed 03 September 2025 |
57.34 (1.41%) |
57.99 |
54.60 - 58.00 |
0.1555 times |
Fri 29 August 2025 |
56.54 (5.9%) |
56.05 |
48.58 - 59.40 |
1.6402 times |
Thu 31 July 2025 |
53.39 (-2.23%) |
57.99 |
49.00 - 58.50 |
1.0079 times |
Fri 03 January 2025 |
54.61 (8.61%) |
50.90 |
50.55 - 55.81 |
0.3724 times |
Tue 31 December 2024 |
50.28 (4.19%) |
49.39 |
46.00 - 51.99 |
1.1661 times |
Fri 29 November 2024 |
48.26 (-0.23%) |
49.79 |
46.51 - 52.50 |
0.681 times |
Thu 31 October 2024 |
48.37 (26.46%) |
66.00 |
45.56 - 66.00 |
2.4671 times |
Fri 12 July 2024 |
38.25 (13.64%) |
34.99 |
32.90 - 39.44 |
1.1011 times |
Fri 28 June 2024 |
33.66 (6.02%) |
31.75 |
30.40 - 34.45 |
0.4715 times |
Fri 31 May 2024 |
31.75 (-13.25%) |
36.50 |
31.00 - 39.65 |
0.9371 times |
Tue 30 April 2024 |
36.60 (16.19%) |
31.55 |
30.60 - 39.70 |
1.0196 times |

DMA SMA EMA moving averages of Vaswani Ind VASWANI_BE
DMA (daily moving average) of Vaswani Ind VASWANI_BE
| DMA period | DMA value | | 5 day DMA | 56.78 | | 12 day DMA | 54.8 | | 20 day DMA | 53.58 | | 35 day DMA | 53.6 | | 50 day DMA | 52.19 | | 100 day DMA | 51.24 | | 150 day DMA | 45.4 | | 200 day DMA | 42.67 | EMA (exponential moving average) of Vaswani Ind VASWANI_BE
| EMA period | EMA current | EMA prev | EMA prev2 | | 5 day EMA | 56.37 | 55.89 | 55.69 | | 12 day EMA | 55.12 | 54.72 | 54.44 | | 20 day EMA | 54.32 | 54 | 53.76 | | 35 day EMA | 53.19 | 52.95 | 52.75 | | 50 day EMA | 52.48 | 52.28 | 52.12 |
SMA (simple moving average) of Vaswani Ind VASWANI_BE
| SMA period | SMA current | SMA prev | SMA prev2 | | 5 day SMA | 56.78 | 56.22 | 55.46 | | 12 day SMA | 54.8 | 54.34 | 53.91 | | 20 day SMA | 53.58 | 53.36 | 53.25 | | 35 day SMA | 53.6 | 53.49 | 53.39 | | 50 day SMA | 52.19 | 52.04 | 51.92 | | 100 day SMA | 51.24 | 51.03 | 50.83 | | 150 day SMA | 45.4 | 45.26 | 45.14 | | 200 day SMA | 42.67 | 42.5 | 42.34 |
|
|
