VasconEngineers VASCONEQ full analysis,charts,indicators,moving averages,SMA,DMA,EMA,ADX,MACD,RSIVascon Engineers VASCONEQ WideScreen charts, DMA,SMA,EMA technical analysis, forecast prediction, by indicators ADX,MACD,RSI,CCI NSE stock exchange
operates under Realty sector
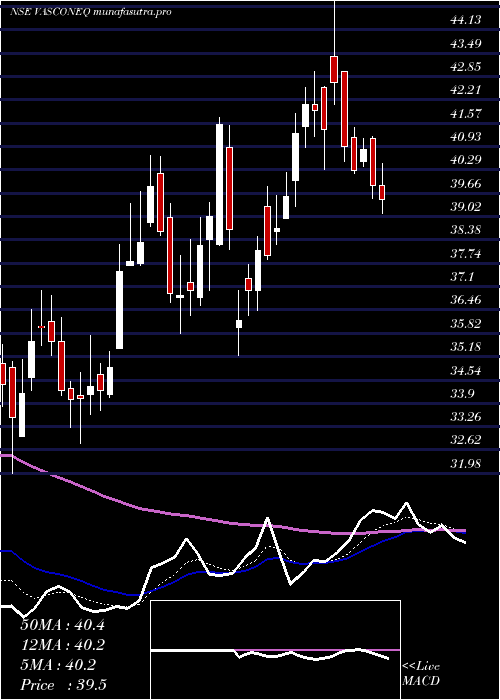
Daily price and charts and targets VasconEngineers Strong Daily Stock price targets for VasconEngineers VASCONEQ are 65.68 and 69.35 | Daily Target 1 | 62.75 | | Daily Target 2 | 64.94 | | Daily Target 3 | 66.42 | | Daily Target 4 | 68.61 | | Daily Target 5 | 70.09 |
Daily price and volume Vascon Engineers
| Date |
Closing |
Open |
Range |
Volume |
Tue 28 October 2025 |
67.13 (3.61%) |
64.50 |
64.23 - 67.90 |
1.1228 times |
Mon 27 October 2025 |
64.79 (1.01%) |
64.25 |
63.57 - 65.66 |
0.6255 times |
Fri 24 October 2025 |
64.14 (-2.34%) |
66.48 |
63.80 - 66.48 |
0.4686 times |
Thu 23 October 2025 |
65.68 (-1.76%) |
67.00 |
65.30 - 67.18 |
0.4676 times |
Tue 21 October 2025 |
66.86 (1.98%) |
65.89 |
65.80 - 67.43 |
0.2848 times |
Mon 20 October 2025 |
65.56 (0.74%) |
65.74 |
64.45 - 66.36 |
0.6164 times |
Fri 17 October 2025 |
65.08 (-2.28%) |
66.70 |
64.55 - 66.71 |
0.7199 times |
Thu 16 October 2025 |
66.60 (-1.35%) |
67.51 |
65.53 - 67.74 |
1.0284 times |
Wed 15 October 2025 |
67.51 (7.21%) |
63.45 |
62.65 - 68.70 |
2.706 times |
Tue 14 October 2025 |
62.97 (-6.09%) |
67.38 |
62.51 - 67.70 |
1.96 times |
Mon 13 October 2025 |
67.05 (-4.58%) |
69.48 |
66.53 - 69.48 |
1.8598 times |
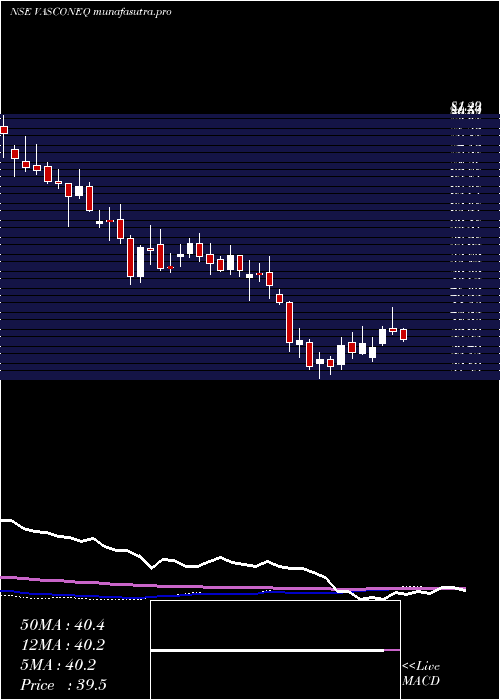
Weekly price and charts VasconEngineers Strong weekly Stock price targets for VasconEngineers VASCONEQ are 65.35 and 69.68 | Weekly Target 1 | 61.87 | | Weekly Target 2 | 64.5 | | Weekly Target 3 | 66.2 | | Weekly Target 4 | 68.83 | | Weekly Target 5 | 70.53 |
Weekly price and volumes for Vascon Engineers
| Date |
Closing |
Open |
Range |
Volume |
Tue 28 October 2025 |
67.13 (4.66%) |
64.25 |
63.57 - 67.90 |
0.175 times |
Fri 24 October 2025 |
64.14 (-1.44%) |
65.74 |
63.80 - 67.43 |
0.1839 times |
Fri 17 October 2025 |
65.08 (-7.39%) |
69.48 |
62.51 - 69.48 |
0.8282 times |
Fri 10 October 2025 |
70.27 (-1.08%) |
71.92 |
66.16 - 74.59 |
1.4537 times |
Fri 03 October 2025 |
71.04 (22.74%) |
61.88 |
61.25 - 72.77 |
3.9493 times |
Fri 26 September 2025 |
57.88 (-9.8%) |
64.00 |
57.53 - 64.18 |
0.3104 times |
Fri 19 September 2025 |
64.17 (11.39%) |
57.61 |
56.63 - 65.90 |
2.2494 times |
Fri 12 September 2025 |
57.61 (2.67%) |
57.49 |
53.89 - 59.00 |
0.343 times |
Fri 05 September 2025 |
56.11 (14.58%) |
49.29 |
49.21 - 57.50 |
0.4527 times |
Fri 29 August 2025 |
48.97 (-5.99%) |
52.09 |
48.67 - 52.61 |
0.0544 times |
Fri 22 August 2025 |
52.09 (8.23%) |
48.63 |
48.63 - 55.80 |
0.1641 times |
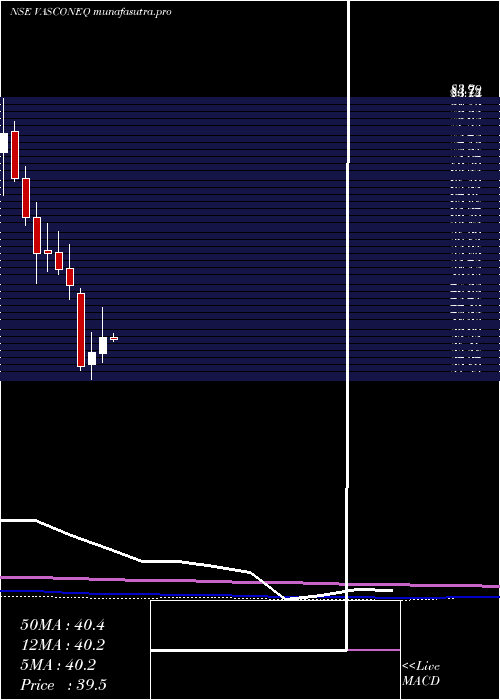
Monthly price and charts VasconEngineers Strong monthly Stock price targets for VasconEngineers VASCONEQ are 58.78 and 70.86 | Monthly Target 1 | 56 | | Monthly Target 2 | 61.56 | | Monthly Target 3 | 68.076666666667 | | Monthly Target 4 | 73.64 | | Monthly Target 5 | 80.16 |
Monthly price and volumes Vascon Engineers
| Date |
Closing |
Open |
Range |
Volume |
Tue 28 October 2025 |
67.13 (-2.37%) |
69.25 |
62.51 - 74.59 |
2.1636 times |
Tue 30 September 2025 |
68.76 (40.41%) |
49.29 |
49.21 - 72.77 |
4.1226 times |
Fri 29 August 2025 |
48.97 (-9.18%) |
53.40 |
47.86 - 57.00 |
0.3401 times |
Thu 31 July 2025 |
53.92 (-0.92%) |
55.20 |
51.01 - 60.38 |
0.6667 times |
Mon 30 June 2025 |
54.42 (1.62%) |
54.00 |
47.15 - 57.60 |
0.4793 times |
Fri 30 May 2025 |
53.55 (34.31%) |
39.87 |
34.26 - 55.15 |
0.7008 times |
Wed 30 April 2025 |
39.87 (7.76%) |
36.81 |
35.20 - 45.38 |
0.3999 times |
Fri 28 March 2025 |
37.00 (7.53%) |
34.88 |
31.98 - 40.70 |
0.5444 times |
Fri 28 February 2025 |
34.41 (-30.43%) |
47.90 |
33.80 - 48.84 |
0.2622 times |
Fri 31 January 2025 |
49.46 (-5.7%) |
52.50 |
46.80 - 56.99 |
0.3204 times |
Tue 31 December 2024 |
52.45 (-5.27%) |
55.50 |
51.50 - 59.30 |
0.3241 times |
DMA SMA EMA moving averages of Vascon Engineers VASCONEQ
DMA (daily moving average) of Vascon Engineers VASCONEQ
| DMA period | DMA value | | 5 day DMA | 65.72 | | 12 day DMA | 66.14 | | 20 day DMA | 67.6 | | 35 day DMA | 64.2 | | 50 day DMA | 60.27 | | 100 day DMA | 56.65 | | 150 day DMA | 52.09 | | 200 day DMA | 49.95 | EMA (exponential moving average) of Vascon Engineers VASCONEQ
| EMA period | EMA current | EMA prev | EMA prev2 | | 5 day EMA | 65.87 | 65.24 | 65.47 | | 12 day EMA | 66.08 | 65.89 | 66.09 | | 20 day EMA | 65.57 | 65.41 | 65.48 | | 35 day EMA | 63.06 | 62.82 | 62.7 | | 50 day EMA | 59.88 | 59.58 | 59.37 |
SMA (simple moving average) of Vascon Engineers VASCONEQ
| SMA period | SMA current | SMA prev | SMA prev2 | | 5 day SMA | 65.72 | 65.41 | 65.46 | | 12 day SMA | 66.14 | 66.48 | 66.95 | | 20 day SMA | 67.6 | 67.14 | 66.95 | | 35 day SMA | 64.2 | 63.89 | 63.54 | | 50 day SMA | 60.27 | 59.9 | 59.57 | | 100 day SMA | 56.65 | 56.52 | 56.41 | | 150 day SMA | 52.09 | 51.89 | 51.69 | | 200 day SMA | 49.95 | 49.88 | 49.83 |
|
|
