V2Retail V2RETAIL full analysis,charts,indicators,moving averages,SMA,DMA,EMA,ADX,MACD,RSIV2 Retail V2RETAIL WideScreen charts, DMA,SMA,EMA technical analysis, forecast prediction, by indicators ADX,MACD,RSI,CCI NSE stock exchange
operates under Department Stores sector
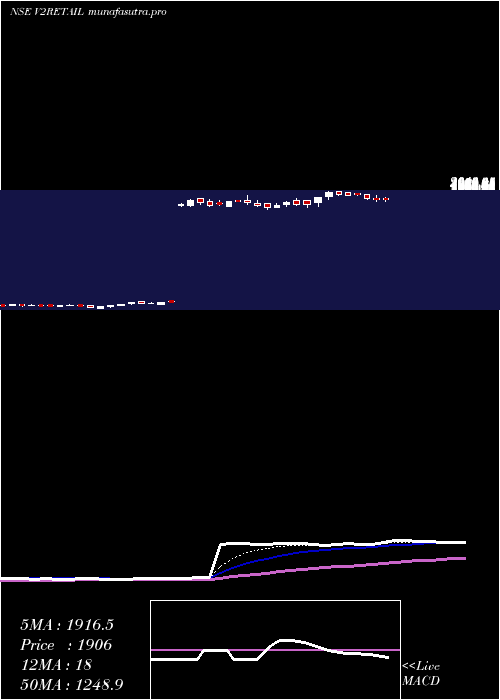
Daily price and charts and targets V2Retail Strong Daily Stock price targets for V2Retail V2RETAIL are 2209.2 and 2278.4 | Daily Target 1 | 2196.33 | | Daily Target 2 | 2222.07 | | Daily Target 3 | 2265.5333333333 | | Daily Target 4 | 2291.27 | | Daily Target 5 | 2334.73 |
Daily price and volume V2 Retail
| Date |
Closing |
Open |
Range |
Volume |
Tue 28 October 2025 |
2247.80 (0.05%) |
2277.00 |
2239.80 - 2309.00 |
0.8879 times |
Mon 27 October 2025 |
2246.70 (-0.04%) |
2283.80 |
2225.30 - 2345.00 |
1.1718 times |
Fri 24 October 2025 |
2247.60 (1.59%) |
2244.40 |
2213.30 - 2274.90 |
0.3921 times |
Thu 23 October 2025 |
2212.40 (-0.05%) |
2240.60 |
2191.00 - 2279.00 |
0.6111 times |
Tue 21 October 2025 |
2213.50 (-1.98%) |
2258.10 |
2176.80 - 2371.00 |
1.2234 times |
Mon 20 October 2025 |
2258.10 (-2.22%) |
2345.00 |
2225.00 - 2357.00 |
0.7576 times |
Fri 17 October 2025 |
2309.30 (1.17%) |
2291.20 |
2198.80 - 2331.00 |
1.6255 times |
Thu 16 October 2025 |
2282.60 (-4.96%) |
2429.90 |
2281.70 - 2450.00 |
1.1235 times |
Wed 15 October 2025 |
2401.70 (2.94%) |
2321.00 |
2318.10 - 2421.00 |
1.7195 times |
Tue 14 October 2025 |
2333.20 (-1.15%) |
2390.00 |
2319.40 - 2424.00 |
0.4877 times |
Mon 13 October 2025 |
2360.30 (-0.67%) |
2350.00 |
2275.00 - 2429.60 |
2.1008 times |
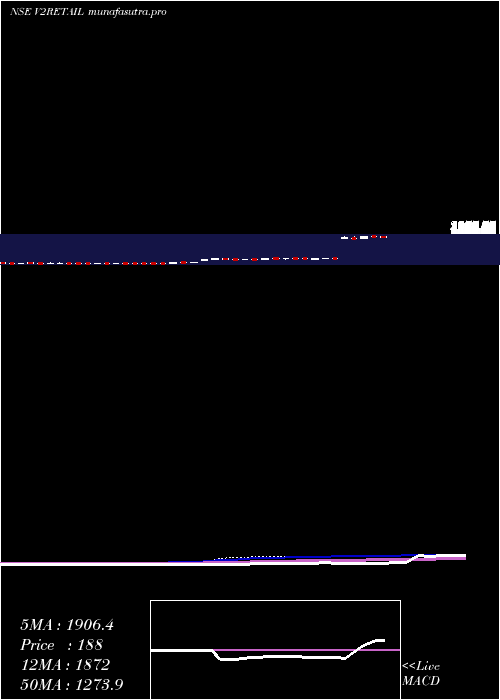
Weekly price and charts V2Retail Strong weekly Stock price targets for V2Retail V2RETAIL are 2176.7 and 2296.4 | Weekly Target 1 | 2153 | | Weekly Target 2 | 2200.4 | | Weekly Target 3 | 2272.7 | | Weekly Target 4 | 2320.1 | | Weekly Target 5 | 2392.4 |
Weekly price and volumes for V2 Retail
| Date |
Closing |
Open |
Range |
Volume |
Tue 28 October 2025 |
2247.80 (0.01%) |
2283.80 |
2225.30 - 2345.00 |
0.4049 times |
Fri 24 October 2025 |
2247.60 (-2.67%) |
2345.00 |
2176.80 - 2371.00 |
0.5867 times |
Fri 17 October 2025 |
2309.30 (-2.82%) |
2350.00 |
2198.80 - 2450.00 |
1.3874 times |
Fri 10 October 2025 |
2376.30 (6.9%) |
2300.00 |
2253.10 - 2465.00 |
1.7825 times |
Fri 03 October 2025 |
2222.90 (17.87%) |
1919.00 |
1919.00 - 2348.90 |
2.3754 times |
Fri 26 September 2025 |
1885.90 (1.5%) |
1873.00 |
1852.50 - 2015.00 |
0.8655 times |
Fri 19 September 2025 |
1858.10 (15.15%) |
1623.00 |
1594.00 - 1918.00 |
0.9127 times |
Fri 12 September 2025 |
1613.70 (-1.39%) |
1640.00 |
1585.60 - 1668.00 |
0.5822 times |
Fri 05 September 2025 |
1636.50 (-5.22%) |
1739.00 |
1621.10 - 1739.00 |
0.6873 times |
Fri 29 August 2025 |
1726.70 (0.34%) |
1720.70 |
1690.00 - 1760.00 |
0.4152 times |
Fri 22 August 2025 |
1720.80 (0.18%) |
1748.00 |
1659.00 - 1837.00 |
0.6448 times |
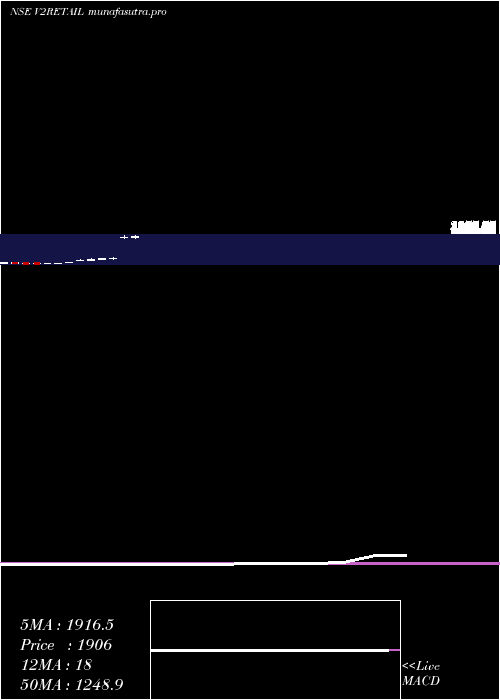
Monthly price and charts V2Retail Strong monthly Stock price targets for V2Retail V2RETAIL are 2149.7 and 2563.1 | Monthly Target 1 | 1841.4 | | Monthly Target 2 | 2044.6 | | Monthly Target 3 | 2254.8 | | Monthly Target 4 | 2458 | | Monthly Target 5 | 2668.2 |
Monthly price and volumes V2 Retail
| Date |
Closing |
Open |
Range |
Volume |
Tue 28 October 2025 |
2247.80 (7.99%) |
2085.00 |
2051.60 - 2465.00 |
1.9101 times |
Tue 30 September 2025 |
2081.40 (20.54%) |
1739.00 |
1585.60 - 2219.70 |
1.5681 times |
Fri 29 August 2025 |
1726.70 (-7.07%) |
1765.10 |
1640.50 - 1837.00 |
0.9213 times |
Thu 31 July 2025 |
1858.00 (2.4%) |
1828.00 |
1788.80 - 2014.00 |
0.8484 times |
Mon 30 June 2025 |
1814.50 (326.94%) |
1811.30 |
1753.20 - 1950.00 |
0.2571 times |
Tue 26 March 2024 |
425.00 (13.12%) |
374.95 |
335.00 - 444.05 |
0.6499 times |
Thu 29 February 2024 |
375.70 (7.88%) |
346.00 |
338.05 - 413.45 |
1.5478 times |
Wed 31 January 2024 |
348.25 (15.93%) |
300.50 |
300.50 - 388.25 |
0.8664 times |
Fri 29 December 2023 |
300.40 (177.63%) |
290.30 |
278.65 - 320.00 |
0.248 times |
Wed 14 June 2023 |
108.20 (11.6%) |
107.40 |
101.00 - 115.00 |
1.183 times |
Wed 31 May 2023 |
96.95 (18.02%) |
82.55 |
75.10 - 96.95 |
0.7245 times |
DMA SMA EMA moving averages of V2 Retail V2RETAIL
DMA (daily moving average) of V2 Retail V2RETAIL
| DMA period | DMA value | | 5 day DMA | 2233.6 | | 12 day DMA | 2290.79 | | 20 day DMA | 2273.83 | | 35 day DMA | 2058.83 | | 50 day DMA | 1958.11 | | 100 day DMA | 1802.23 | | 150 day DMA | 1321.6 | | 200 day DMA | 1020.77 | EMA (exponential moving average) of V2 Retail V2RETAIL
| EMA period | EMA current | EMA prev | EMA prev2 | | 5 day EMA | 2249.23 | 2249.94 | 2251.56 | | 12 day EMA | 2253.43 | 2254.45 | 2255.86 | | 20 day EMA | 2211.26 | 2207.41 | 2203.28 | | 35 day EMA | 2106.88 | 2098.58 | 2089.86 | | 50 day EMA | 1966.18 | 1954.69 | 1942.78 |
SMA (simple moving average) of V2 Retail V2RETAIL
| SMA period | SMA current | SMA prev | SMA prev2 | | 5 day SMA | 2233.6 | 2235.66 | 2248.18 | | 12 day SMA | 2290.79 | 2307.27 | 2316.98 | | 20 day SMA | 2273.83 | 2255.73 | 2239.83 | | 35 day SMA | 2058.83 | 2041.36 | 2024.79 | | 50 day SMA | 1958.11 | 1947.57 | 1937.27 | | 100 day SMA | 1802.23 | 1783.32 | 1764.37 | | 150 day SMA | 1321.6 | 1308.93 | 1296.15 | | 200 day SMA | 1020.77 | 1009.94 | 999.11 |
|
|
