UtssavCz UTSSAV_SM full analysis,charts,indicators,moving averages,SMA,DMA,EMA,ADX,MACD,RSIUtssav Cz UTSSAV_SM WideScreen charts, DMA,SMA,EMA technical analysis, forecast prediction, by indicators ADX,MACD,RSI,CCI NSE stock exchange
Daily price and charts and targets UtssavCz Strong Daily Stock price targets for UtssavCz UTSSAV_SM are 218.03 and 225.03 | Daily Target 1 | 212.35 | | Daily Target 2 | 216.7 | | Daily Target 3 | 219.35 | | Daily Target 4 | 223.7 | | Daily Target 5 | 226.35 |
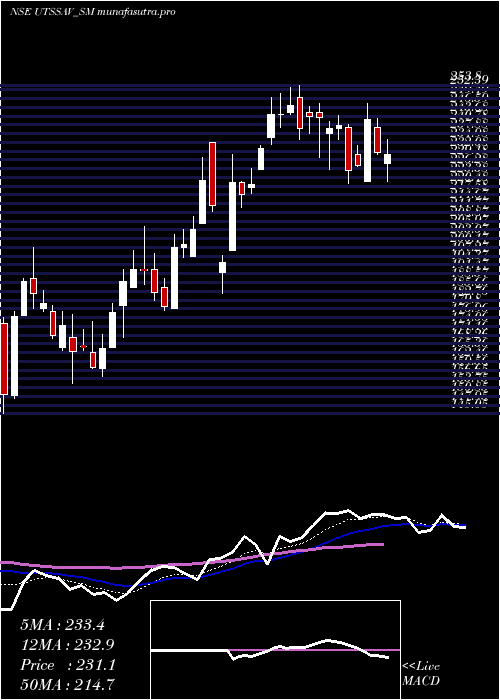
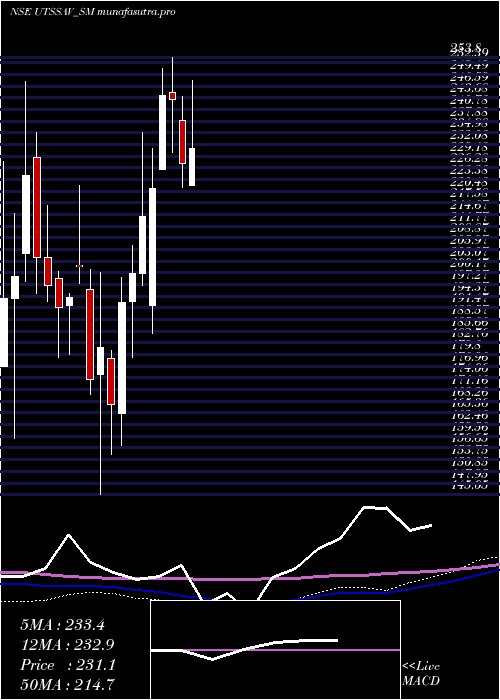
Daily price and volume Utssav Cz
| Date |
Closing |
Open |
Range |
Volume |
Tue 28 October 2025 |
221.05 (2.89%) |
216.00 |
215.00 - 222.00 |
1.0299 times |
Mon 27 October 2025 |
214.85 (5.73%) |
210.10 |
206.90 - 218.00 |
2.7025 times |
Fri 24 October 2025 |
203.20 (2.89%) |
200.50 |
199.00 - 205.75 |
0.9419 times |
Thu 23 October 2025 |
197.50 (-1.42%) |
200.00 |
196.25 - 209.50 |
0.5546 times |
Tue 21 October 2025 |
200.35 (0.98%) |
205.45 |
198.20 - 205.45 |
0.1056 times |
Mon 20 October 2025 |
198.40 (0.28%) |
198.00 |
193.50 - 203.80 |
0.2817 times |
Fri 17 October 2025 |
197.85 (-3.86%) |
206.00 |
195.70 - 214.90 |
1.118 times |
Thu 16 October 2025 |
205.80 (4.97%) |
194.00 |
193.50 - 211.90 |
1.7518 times |
Wed 15 October 2025 |
196.05 (0.44%) |
201.95 |
193.00 - 202.00 |
0.7394 times |
Tue 14 October 2025 |
195.20 (1.01%) |
202.70 |
181.00 - 202.70 |
0.7746 times |
Mon 13 October 2025 |
193.25 (-1.23%) |
194.95 |
188.15 - 196.65 |
1.2412 times |
Weekly price and charts UtssavCz Strong weekly Stock price targets for UtssavCz UTSSAV_SM are 213.98 and 229.08 | Weekly Target 1 | 201.55 | | Weekly Target 2 | 211.3 | | Weekly Target 3 | 216.65 | | Weekly Target 4 | 226.4 | | Weekly Target 5 | 231.75 |
Weekly price and volumes for Utssav Cz
| Date |
Closing |
Open |
Range |
Volume |
Tue 28 October 2025 |
221.05 (8.78%) |
210.10 |
206.90 - 222.00 |
1.0237 times |
Fri 24 October 2025 |
203.20 (2.7%) |
198.00 |
193.50 - 209.50 |
0.5167 times |
Fri 17 October 2025 |
197.85 (1.12%) |
194.95 |
181.00 - 214.90 |
1.5427 times |
Fri 10 October 2025 |
195.65 (14.42%) |
169.05 |
160.05 - 196.55 |
2.844 times |
Fri 03 October 2025 |
171.00 (-5%) |
182.50 |
163.05 - 185.40 |
0.7122 times |
Fri 26 September 2025 |
180.00 (-4.64%) |
189.75 |
178.00 - 198.00 |
0.548 times |
Fri 19 September 2025 |
188.75 (-4.72%) |
201.00 |
186.00 - 208.50 |
0.845 times |
Fri 12 September 2025 |
198.10 (5.63%) |
186.10 |
180.00 - 207.00 |
0.9874 times |
Fri 05 September 2025 |
187.55 (-3.82%) |
197.50 |
184.55 - 199.00 |
0.6808 times |
Fri 29 August 2025 |
195.00 (-23.48%) |
209.00 |
190.00 - 209.00 |
0.2994 times |
Tue 20 May 2025 |
254.85 (-1.32%) |
262.95 |
252.00 - 277.50 |
0.7653 times |
Monthly price and charts UtssavCz Strong monthly Stock price targets for UtssavCz UTSSAV_SM are 190.55 and 252.5 | Monthly Target 1 | 139.08 | | Monthly Target 2 | 180.07 | | Monthly Target 3 | 201.03333333333 | | Monthly Target 4 | 242.02 | | Monthly Target 5 | 262.98 |
Monthly price and volumes Utssav Cz
| Date |
Closing |
Open |
Range |
Volume |
Tue 28 October 2025 |
221.05 (26.28%) |
173.00 |
160.05 - 222.00 |
0.747 times |
Tue 30 September 2025 |
175.05 (-10.23%) |
197.50 |
171.00 - 208.50 |
0.3763 times |
Fri 29 August 2025 |
195.00 (-23.48%) |
209.00 |
190.00 - 209.00 |
0.0347 times |
Tue 20 May 2025 |
254.85 (12.89%) |
231.00 |
202.05 - 277.50 |
0.3897 times |
Wed 30 April 2025 |
225.75 (12.85%) |
200.00 |
185.00 - 253.80 |
0.5482 times |
Fri 28 March 2025 |
200.05 (15.14%) |
175.00 |
145.05 - 207.00 |
0.8748 times |
Fri 28 February 2025 |
173.75 (-10.46%) |
202.00 |
170.00 - 222.00 |
0.414 times |
Tue 08 October 2024 |
194.05 (-0.28%) |
194.60 |
179.20 - 200.50 |
0.4082 times |
Mon 30 September 2024 |
194.60 (0.46%) |
193.75 |
159.00 - 247.80 |
3.7742 times |
Fri 30 August 2024 |
193.70 (0%) |
171.00 |
155.00 - 227.80 |
2.4328 times |
Wed 29 October 2025 |
(0%) |
|
- |
0 times |

DMA SMA EMA moving averages of Utssav Cz UTSSAV_SM
DMA (daily moving average) of Utssav Cz UTSSAV_SM
| DMA period | DMA value | | 5 day DMA | 207.39 | | 12 day DMA | 201.6 | | 20 day DMA | 188.64 | | 35 day DMA | 189.57 | | 50 day DMA | 197.45 | | 100 day DMA | 201.69 | | 150 day DMA | | | 200 day DMA | | EMA (exponential moving average) of Utssav Cz UTSSAV_SM
| EMA period | EMA current | EMA prev | EMA prev2 | | 5 day EMA | 210.14 | 204.68 | 199.6 | | 12 day EMA | 201.11 | 197.49 | 194.33 | | 20 day EMA | 196.86 | 194.31 | 192.15 | | 35 day EMA | 197.86 | 196.5 | 195.42 | | 50 day EMA | 201.14 | 200.33 | 199.74 |
SMA (simple moving average) of Utssav Cz UTSSAV_SM
| SMA period | SMA current | SMA prev | SMA prev2 | | 5 day SMA | 207.39 | 202.86 | 199.46 | | 12 day SMA | 201.6 | 196.83 | 192.75 | | 20 day SMA | 188.64 | 186.59 | 184.96 | | 35 day SMA | 189.57 | 188.61 | 187.8 | | 50 day SMA | 197.45 | 197.84 | 197.94 | | 100 day SMA | 201.69 | 201.5 | 201.55 | | 150 day SMA | | 200 day SMA |
|
|
