UtiAsset UTIAMC full analysis,charts,indicators,moving averages,SMA,DMA,EMA,ADX,MACD,RSIUti Asset UTIAMC WideScreen charts, DMA,SMA,EMA technical analysis, forecast prediction, by indicators ADX,MACD,RSI,CCI NSE stock exchange
Daily price and charts and targets UtiAsset Strong Daily Stock price targets for UtiAsset UTIAMC are 1288.5 and 1317 | Daily Target 1 | 1283.3 | | Daily Target 2 | 1293.7 | | Daily Target 3 | 1311.8 | | Daily Target 4 | 1322.2 | | Daily Target 5 | 1340.3 |
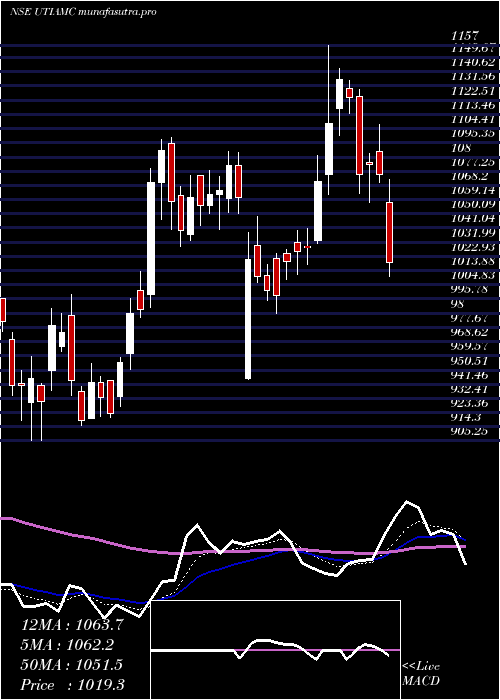
Daily price and volume Uti Asset
| Date |
Closing |
Open |
Range |
Volume |
Tue 28 October 2025 |
1304.10 (-1%) |
1317.30 |
1301.40 - 1329.90 |
0.2883 times |
Mon 27 October 2025 |
1317.30 (-1.72%) |
1340.00 |
1315.00 - 1345.00 |
0.3978 times |
Fri 24 October 2025 |
1340.30 (2.05%) |
1315.00 |
1300.90 - 1343.90 |
0.8363 times |
Thu 23 October 2025 |
1313.40 (-2.04%) |
1328.50 |
1299.00 - 1336.70 |
1.3744 times |
Tue 21 October 2025 |
1340.70 (0.05%) |
1340.00 |
1335.00 - 1353.00 |
0.1615 times |
Mon 20 October 2025 |
1340.00 (-4.41%) |
1361.80 |
1263.30 - 1361.80 |
4.5341 times |
Fri 17 October 2025 |
1401.80 (1.69%) |
1380.00 |
1370.40 - 1409.00 |
1.0655 times |
Thu 16 October 2025 |
1378.50 (0.07%) |
1374.00 |
1368.50 - 1391.00 |
0.2693 times |
Wed 15 October 2025 |
1377.60 (0.73%) |
1370.10 |
1353.50 - 1385.00 |
0.371 times |
Tue 14 October 2025 |
1367.60 (-0.3%) |
1369.10 |
1360.00 - 1389.00 |
0.7017 times |
Mon 13 October 2025 |
1371.70 (4.59%) |
1311.00 |
1307.00 - 1385.00 |
2.8515 times |
Weekly price and charts UtiAsset Strong weekly Stock price targets for UtiAsset UTIAMC are 1280.95 and 1324.55 | Weekly Target 1 | 1273.23 | | Weekly Target 2 | 1288.67 | | Weekly Target 3 | 1316.8333333333 | | Weekly Target 4 | 1332.27 | | Weekly Target 5 | 1360.43 |
Weekly price and volumes for Uti Asset
| Date |
Closing |
Open |
Range |
Volume |
Tue 28 October 2025 |
1304.10 (-2.7%) |
1340.00 |
1301.40 - 1345.00 |
0.2471 times |
Fri 24 October 2025 |
1340.30 (-4.39%) |
1361.80 |
1263.30 - 1361.80 |
2.4877 times |
Fri 17 October 2025 |
1401.80 (6.89%) |
1311.00 |
1307.00 - 1409.00 |
1.8944 times |
Fri 10 October 2025 |
1311.50 (-0.22%) |
1318.00 |
1273.50 - 1335.00 |
1.2966 times |
Fri 03 October 2025 |
1314.40 (0.27%) |
1315.20 |
1295.00 - 1338.90 |
0.7052 times |
Fri 26 September 2025 |
1310.90 (-3.62%) |
1354.10 |
1302.30 - 1418.00 |
0.9321 times |
Fri 19 September 2025 |
1360.20 (0.58%) |
1360.00 |
1338.20 - 1377.80 |
0.4234 times |
Fri 12 September 2025 |
1352.40 (2.08%) |
1320.40 |
1315.50 - 1371.80 |
0.5741 times |
Fri 05 September 2025 |
1324.90 (2.82%) |
1287.90 |
1285.50 - 1364.70 |
0.5373 times |
Fri 29 August 2025 |
1288.50 (-6.39%) |
1376.70 |
1275.00 - 1380.10 |
0.9022 times |
Fri 22 August 2025 |
1376.50 (3.43%) |
1344.50 |
1334.80 - 1414.00 |
0.999 times |

Monthly price and charts UtiAsset Strong monthly Stock price targets for UtiAsset UTIAMC are 1210.85 and 1356.55 | Monthly Target 1 | 1179.77 | | Monthly Target 2 | 1241.93 | | Monthly Target 3 | 1325.4666666667 | | Monthly Target 4 | 1387.63 | | Monthly Target 5 | 1471.17 |
Monthly price and volumes Uti Asset
| Date |
Closing |
Open |
Range |
Volume |
Tue 28 October 2025 |
1304.10 (0%) |
1312.90 |
1263.30 - 1409.00 |
1.0325 times |
Tue 30 September 2025 |
1304.10 (1.21%) |
1287.90 |
1285.50 - 1418.00 |
0.433 times |
Fri 29 August 2025 |
1288.50 (-3.11%) |
1329.80 |
1275.00 - 1414.00 |
0.5922 times |
Thu 31 July 2025 |
1329.80 (3.02%) |
1299.00 |
1257.00 - 1494.80 |
1.9508 times |
Mon 30 June 2025 |
1290.80 (8.45%) |
1190.20 |
1143.00 - 1305.90 |
1.6607 times |
Fri 30 May 2025 |
1190.20 (16.77%) |
1030.00 |
959.90 - 1217.60 |
0.9647 times |
Wed 30 April 2025 |
1019.30 (-3.41%) |
1055.25 |
944.55 - 1157.00 |
0.9521 times |
Fri 28 March 2025 |
1055.25 (12.15%) |
941.95 |
905.25 - 1098.60 |
0.842 times |
Fri 28 February 2025 |
940.90 (-9.4%) |
1052.00 |
905.00 - 1105.00 |
0.5269 times |
Fri 31 January 2025 |
1038.50 (-22.65%) |
1350.00 |
994.00 - 1400.00 |
1.0451 times |
Tue 31 December 2024 |
1342.55 (3.34%) |
1298.55 |
1206.05 - 1403.65 |
1.1645 times |

DMA SMA EMA moving averages of Uti Asset UTIAMC
DMA (daily moving average) of Uti Asset UTIAMC
| DMA period | DMA value | | 5 day DMA | 1323.16 | | 12 day DMA | 1347.04 | | 20 day DMA | 1330.81 | | 35 day DMA | 1342.29 | | 50 day DMA | 1343.27 | | 100 day DMA | 1332.14 | | 150 day DMA | 1249.42 | | 200 day DMA | 1200.1 | EMA (exponential moving average) of Uti Asset UTIAMC
| EMA period | EMA current | EMA prev | EMA prev2 | | 5 day EMA | 1323.51 | 1333.22 | 1341.18 | | 12 day EMA | 1334.2 | 1339.67 | 1343.73 | | 20 day EMA | 1337.11 | 1340.58 | 1343.03 | | 35 day EMA | 1338.31 | 1340.32 | 1341.68 | | 50 day EMA | 1340.23 | 1341.7 | 1342.7 |
SMA (simple moving average) of Uti Asset UTIAMC
| SMA period | SMA current | SMA prev | SMA prev2 | | 5 day SMA | 1323.16 | 1330.34 | 1347.24 | | 12 day SMA | 1347.04 | 1345.16 | 1342.83 | | 20 day SMA | 1330.81 | 1331.15 | 1333.48 | | 35 day SMA | 1342.29 | 1342.89 | 1343.76 | | 50 day SMA | 1343.27 | 1343.73 | 1344.1 | | 100 day SMA | 1332.14 | 1330.65 | 1329.04 | | 150 day SMA | 1249.42 | 1247.31 | 1244.89 | | 200 day SMA | 1200.1 | 1200 | 1200.23 |
|
|
