UshaFinancial USHAFIN_SM full analysis,charts,indicators,moving averages,SMA,DMA,EMA,ADX,MACD,RSIUsha Financial USHAFIN_SM WideScreen charts, DMA,SMA,EMA technical analysis, forecast prediction, by indicators ADX,MACD,RSI,CCI NSE stock exchange
Daily price and charts and targets UshaFinancial Strong Daily Stock price targets for UshaFinancial USHAFIN_SM are 47.5 and 50.6 | Daily Target 1 | 45.27 | | Daily Target 2 | 46.63 | | Daily Target 3 | 48.366666666667 | | Daily Target 4 | 49.73 | | Daily Target 5 | 51.47 |
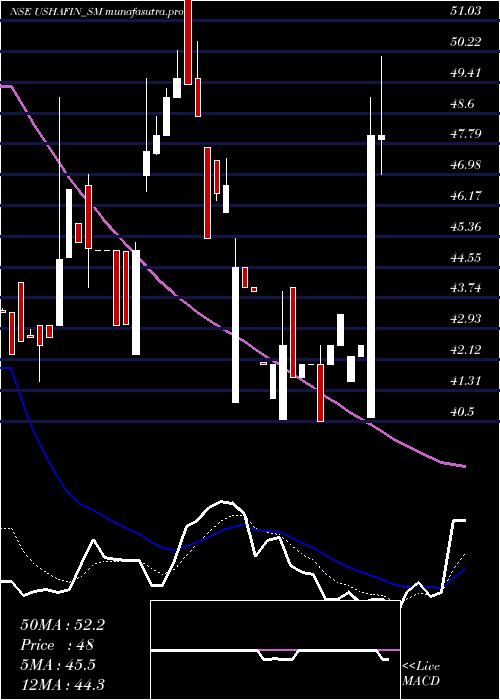
Daily price and volume Usha Financial
| Date |
Closing |
Open |
Range |
Volume |
Tue 28 October 2025 |
48.00 (0%) |
47.90 |
47.00 - 50.10 |
0.6612 times |
Mon 27 October 2025 |
48.00 (12.94%) |
40.60 |
40.60 - 49.00 |
6.4463 times |
Fri 24 October 2025 |
42.50 (0.71%) |
42.20 |
42.20 - 42.50 |
0.1653 times |
Thu 23 October 2025 |
42.20 (-2.54%) |
41.55 |
41.55 - 42.20 |
1.3636 times |
Tue 21 October 2025 |
43.30 (1.88%) |
42.50 |
42.50 - 43.30 |
0.124 times |
Mon 20 October 2025 |
42.50 (4.94%) |
42.00 |
42.00 - 42.50 |
0.6198 times |
Fri 17 October 2025 |
40.50 (-3.57%) |
42.00 |
40.50 - 42.50 |
0.3306 times |
Thu 16 October 2025 |
42.00 (0%) |
42.00 |
42.00 - 42.00 |
0.124 times |
Wed 15 October 2025 |
42.00 (0.84%) |
41.65 |
41.65 - 42.00 |
0.0826 times |
Tue 14 October 2025 |
41.65 (-2%) |
44.00 |
41.65 - 44.00 |
0.0826 times |
Mon 13 October 2025 |
42.50 (1.19%) |
40.55 |
40.55 - 43.90 |
1.0331 times |
Weekly price and charts UshaFinancial Strong weekly Stock price targets for UshaFinancial USHAFIN_SM are 44.3 and 53.8 | Weekly Target 1 | 36.73 | | Weekly Target 2 | 42.37 | | Weekly Target 3 | 46.233333333333 | | Weekly Target 4 | 51.87 | | Weekly Target 5 | 55.73 |
Weekly price and volumes for Usha Financial
| Date |
Closing |
Open |
Range |
Volume |
Tue 28 October 2025 |
48.00 (12.94%) |
40.60 |
40.60 - 50.10 |
3.3992 times |
Fri 24 October 2025 |
42.50 (4.94%) |
42.00 |
41.55 - 43.30 |
1.087 times |
Fri 17 October 2025 |
40.50 (-3.57%) |
40.55 |
40.50 - 44.00 |
0.7905 times |
Fri 10 October 2025 |
42.00 (-10.06%) |
41.00 |
41.00 - 45.30 |
0.3557 times |
Fri 03 October 2025 |
46.70 (-5.37%) |
49.50 |
45.30 - 50.50 |
0.3953 times |
Fri 26 September 2025 |
49.35 (3.68%) |
47.55 |
47.50 - 51.70 |
1.3636 times |
Fri 19 September 2025 |
47.60 (5.78%) |
45.00 |
42.25 - 49.50 |
1.0474 times |
Fri 12 September 2025 |
45.00 (5.39%) |
43.00 |
43.00 - 49.00 |
0.8103 times |
Thu 04 September 2025 |
42.70 (1.07%) |
44.15 |
41.55 - 44.15 |
0.3755 times |
Fri 29 August 2025 |
42.25 (-4.3%) |
43.50 |
42.25 - 45.85 |
0.3755 times |
Fri 22 August 2025 |
44.15 (-53.08%) |
96.00 |
44.15 - 96.00 |
2.6285 times |

Monthly price and charts UshaFinancial Strong monthly Stock price targets for UshaFinancial USHAFIN_SM are 44.25 and 53.85 | Monthly Target 1 | 36.6 | | Monthly Target 2 | 42.3 | | Monthly Target 3 | 46.2 | | Monthly Target 4 | 51.9 | | Monthly Target 5 | 55.8 |
Monthly price and volumes Usha Financial
| Date |
Closing |
Open |
Range |
Volume |
Tue 28 October 2025 |
48.00 (5.96%) |
47.35 |
40.50 - 50.10 |
1.0082 times |
Tue 30 September 2025 |
45.30 (7.22%) |
44.15 |
41.55 - 51.70 |
0.6562 times |
Fri 29 August 2025 |
42.25 (-53.06%) |
88.00 |
42.25 - 105.00 |
0.8065 times |
Thu 31 July 2025 |
90.00 (49.5%) |
98.85 |
82.20 - 107.65 |
0.6579 times |
Tue 18 March 2025 |
60.20 (-25.36%) |
77.05 |
54.10 - 79.95 |
1.7908 times |
Fri 28 February 2025 |
80.65 (-22.67%) |
104.35 |
78.00 - 117.90 |
0.6732 times |
Fri 31 January 2025 |
104.30 (-13.08%) |
121.45 |
94.55 - 132.90 |
1.4764 times |
Tue 31 December 2024 |
120.00 (2.52%) |
119.00 |
116.00 - 139.85 |
1.4114 times |
Fri 29 November 2024 |
117.05 (0%) |
119.95 |
113.70 - 126.45 |
0.5195 times |
Wed 29 October 2025 |
(0%) |
|
- |
0 times |

DMA SMA EMA moving averages of Usha Financial USHAFIN_SM
DMA (daily moving average) of Usha Financial USHAFIN_SM
| DMA period | DMA value | | 5 day DMA | 44.8 | | 12 day DMA | 43.1 | | 20 day DMA | 43.93 | | 35 day DMA | 44.78 | | 50 day DMA | 48.51 | | 100 day DMA | 69.15 | | 150 day DMA | 84.79 | | 200 day DMA | | EMA (exponential moving average) of Usha Financial USHAFIN_SM
| EMA period | EMA current | EMA prev | EMA prev2 | | 5 day EMA | 45.51 | 44.26 | 42.39 | | 12 day EMA | 44.28 | 43.6 | 42.8 | | 20 day EMA | 44.86 | 44.53 | 44.16 | | 35 day EMA | 48.11 | 48.12 | 48.13 | | 50 day EMA | 51.67 | 51.82 | 51.98 |
SMA (simple moving average) of Usha Financial USHAFIN_SM
| SMA period | SMA current | SMA prev | SMA prev2 | | 5 day SMA | 44.8 | 43.7 | 42.2 | | 12 day SMA | 43.1 | 42.6 | 42.25 | | 20 day SMA | 43.93 | 44 | 44.07 | | 35 day SMA | 44.78 | 44.63 | 44.47 | | 50 day SMA | 48.51 | 49.41 | 50.45 | | 100 day SMA | 69.15 | 69.72 | 70.29 | | 150 day SMA | 84.79 | 85.29 | | 200 day SMA |
|
|
