UnivastuIndia UNIVASTU full analysis,charts,indicators,moving averages,SMA,DMA,EMA,ADX,MACD,RSIUnivastu India UNIVASTU WideScreen charts, DMA,SMA,EMA technical analysis, forecast prediction, by indicators ADX,MACD,RSI,CCI NSE stock exchange
Daily price and charts and targets UnivastuIndia Strong Daily Stock price targets for UnivastuIndia UNIVASTU are 68.53 and 71.93 | Daily Target 1 | 67.82 | | Daily Target 2 | 69.23 | | Daily Target 3 | 71.216666666667 | | Daily Target 4 | 72.63 | | Daily Target 5 | 74.62 |
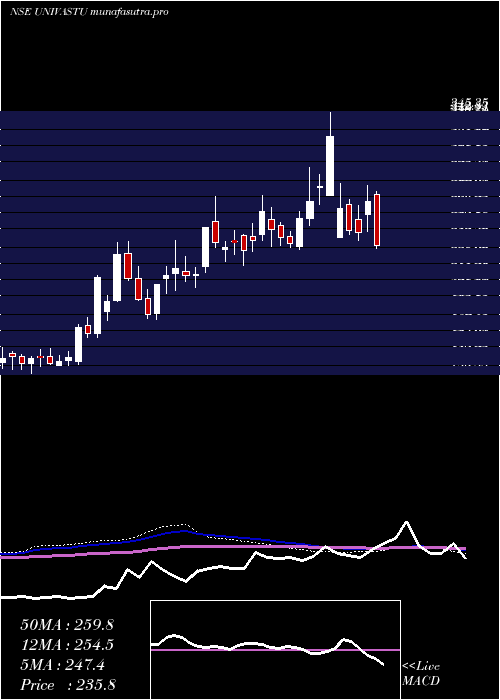
Daily price and volume Univastu India
| Date |
Closing |
Open |
Range |
Volume |
Tue 28 October 2025 |
70.65 (-1.19%) |
71.55 |
69.80 - 73.20 |
0.9048 times |
Mon 27 October 2025 |
71.50 (-1.73%) |
71.36 |
71.00 - 77.00 |
3.2058 times |
Fri 24 October 2025 |
72.76 (-0.42%) |
73.00 |
72.50 - 73.00 |
0.1482 times |
Thu 23 October 2025 |
73.07 (-0.95%) |
75.00 |
72.49 - 75.00 |
0.413 times |
Tue 21 October 2025 |
73.77 (-0.46%) |
74.00 |
72.50 - 75.94 |
0.1439 times |
Mon 20 October 2025 |
74.11 (0.83%) |
74.00 |
72.50 - 74.40 |
0.3504 times |
Fri 17 October 2025 |
73.50 (-2.09%) |
73.20 |
73.01 - 79.66 |
1.3087 times |
Thu 16 October 2025 |
75.07 (-5.39%) |
78.50 |
74.00 - 78.50 |
1.4231 times |
Wed 15 October 2025 |
79.35 (-7%) |
85.32 |
77.48 - 85.32 |
1.4469 times |
Tue 14 October 2025 |
85.32 (-2.82%) |
88.99 |
83.38 - 89.99 |
0.6551 times |
Mon 13 October 2025 |
87.80 (-66.51%) |
90.00 |
85.71 - 104.88 |
12.2831 times |

Weekly price and charts UnivastuIndia Strong weekly Stock price targets for UnivastuIndia UNIVASTU are 66.63 and 73.83 | Weekly Target 1 | 65.28 | | Weekly Target 2 | 67.97 | | Weekly Target 3 | 72.483333333333 | | Weekly Target 4 | 75.17 | | Weekly Target 5 | 79.68 |
Weekly price and volumes for Univastu India
| Date |
Closing |
Open |
Range |
Volume |
Tue 28 October 2025 |
70.65 (-2.9%) |
71.36 |
69.80 - 77.00 |
1.0009 times |
Fri 24 October 2025 |
72.76 (-1.01%) |
74.00 |
72.49 - 75.94 |
0.257 times |
Fri 17 October 2025 |
73.50 (-71.97%) |
90.00 |
73.01 - 104.88 |
4.1676 times |
Fri 10 October 2025 |
262.20 (11.67%) |
236.60 |
234.00 - 272.80 |
0.478 times |
Fri 03 October 2025 |
234.79 (1.46%) |
231.40 |
227.45 - 241.95 |
0.1809 times |
Fri 26 September 2025 |
231.40 (-5.72%) |
242.00 |
231.00 - 259.80 |
0.6248 times |
Fri 19 September 2025 |
245.45 (-3.95%) |
262.00 |
242.00 - 262.00 |
0.1901 times |
Fri 12 September 2025 |
255.55 (-2.72%) |
263.70 |
251.40 - 263.95 |
0.1491 times |
Fri 05 September 2025 |
262.70 (2.36%) |
256.65 |
252.00 - 273.90 |
0.8867 times |
Fri 29 August 2025 |
256.65 (-6.88%) |
280.00 |
247.00 - 300.00 |
2.0648 times |
Fri 22 August 2025 |
275.60 (3.22%) |
274.40 |
261.00 - 279.00 |
0.9063 times |
Monthly price and charts UnivastuIndia Strong monthly Stock price targets for UnivastuIndia UNIVASTU are -31.28 and 171.73 | Monthly Target 1 | -65.25 | | Monthly Target 2 | 2.7 | | Monthly Target 3 | 137.75 | | Monthly Target 4 | 205.7 | | Monthly Target 5 | 340.75 |
Monthly price and volumes Univastu India
| Date |
Closing |
Open |
Range |
Volume |
Tue 28 October 2025 |
70.65 (-69.47%) |
231.50 |
69.80 - 272.80 |
1.675 times |
Tue 30 September 2025 |
231.40 (-9.84%) |
256.65 |
227.45 - 273.90 |
0.5287 times |
Fri 29 August 2025 |
256.65 (-2.02%) |
265.05 |
247.00 - 300.00 |
0.9215 times |
Thu 31 July 2025 |
261.93 (4.81%) |
254.41 |
234.99 - 320.00 |
2.4919 times |
Mon 30 June 2025 |
249.92 (11.75%) |
225.00 |
215.00 - 264.99 |
0.7609 times |
Fri 30 May 2025 |
223.65 (-12.83%) |
258.10 |
214.30 - 285.00 |
0.3537 times |
Wed 30 April 2025 |
256.56 (-21.18%) |
242.22 |
242.20 - 286.46 |
0.1402 times |
Fri 17 January 2025 |
325.50 (13.63%) |
298.90 |
265.30 - 345.35 |
1.5974 times |
Tue 31 December 2024 |
286.45 (8.53%) |
257.50 |
232.85 - 286.90 |
1.1214 times |
Fri 29 November 2024 |
263.94 (13.4%) |
232.00 |
219.34 - 276.71 |
0.4095 times |
Thu 31 October 2024 |
232.75 (4.5%) |
223.90 |
201.10 - 276.09 |
1.3479 times |

DMA SMA EMA moving averages of Univastu India UNIVASTU
DMA (daily moving average) of Univastu India UNIVASTU
| DMA period | DMA value | | 5 day DMA | 72.35 | | 12 day DMA | 91.59 | | 20 day DMA | 151.15 | | 35 day DMA | 193.27 | | 50 day DMA | 214.6 | | 100 day DMA | 235.5 | | 150 day DMA | 244.59 | | 200 day DMA | 243.49 | EMA (exponential moving average) of Univastu India UNIVASTU
| EMA period | EMA current | EMA prev | EMA prev2 | | 5 day EMA | 74.37 | 76.23 | 78.6 | | 12 day EMA | 101.58 | 107.2 | 113.69 | | 20 day EMA | 132.23 | 138.71 | 145.78 | | 35 day EMA | 169.39 | 175.2 | 181.3 | | 50 day EMA | 203.82 | 209.25 | 214.87 |
SMA (simple moving average) of Univastu India UNIVASTU
| SMA period | SMA current | SMA prev | SMA prev2 | | 5 day SMA | 72.35 | 73.04 | 73.44 | | 12 day SMA | 91.59 | 107.38 | 122.78 | | 20 day SMA | 151.15 | 159.19 | 167.6 | | 35 day SMA | 193.27 | 198.76 | 204.07 | | 50 day SMA | 214.6 | 218.54 | 222.16 | | 100 day SMA | 235.5 | 236.99 | 238.44 | | 150 day SMA | 244.59 | 245.69 | 246.8 | | 200 day SMA | 243.49 | 244.19 | 244.85 |
|
|
