UnichemLaboratories UNICHEMLAB full analysis,charts,indicators,moving averages,SMA,DMA,EMA,ADX,MACD,RSIUnichem Laboratories UNICHEMLAB WideScreen charts, DMA,SMA,EMA technical analysis, forecast prediction, by indicators ADX,MACD,RSI,CCI NSE stock exchange
operates under Pharmaceuticals sector
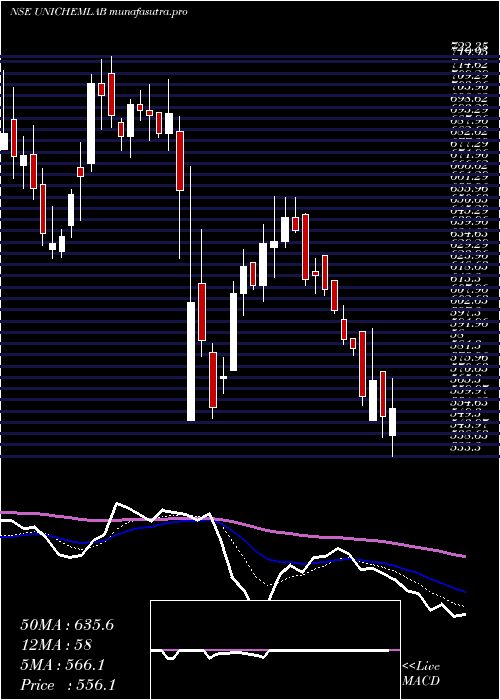
Daily price and charts and targets UnichemLaboratories Strong Daily Stock price targets for UnichemLaboratories UNICHEMLAB are 456.18 and 470.28 | Daily Target 1 | 453.05 | | Daily Target 2 | 459.3 | | Daily Target 3 | 467.15 | | Daily Target 4 | 473.4 | | Daily Target 5 | 481.25 |
Daily price and volume Unichem Laboratories
| Date |
Closing |
Open |
Range |
Volume |
Tue 28 October 2025 |
465.55 (-0.97%) |
475.00 |
460.90 - 475.00 |
0.9856 times |
Mon 27 October 2025 |
470.10 (0.21%) |
473.80 |
464.65 - 473.80 |
0.547 times |
Fri 24 October 2025 |
469.10 (0.41%) |
467.20 |
463.95 - 473.95 |
0.7265 times |
Thu 23 October 2025 |
467.20 (0.59%) |
471.40 |
465.05 - 471.40 |
0.9711 times |
Tue 21 October 2025 |
464.45 (-0.33%) |
473.00 |
461.50 - 475.00 |
0.5212 times |
Mon 20 October 2025 |
466.00 (0.12%) |
469.30 |
463.75 - 475.00 |
0.8733 times |
Fri 17 October 2025 |
465.45 (-0.82%) |
469.30 |
459.95 - 473.50 |
1.6211 times |
Thu 16 October 2025 |
469.30 (-1.22%) |
475.10 |
465.10 - 478.10 |
1.0343 times |
Wed 15 October 2025 |
475.10 (0.95%) |
470.65 |
465.00 - 479.75 |
2.0699 times |
Tue 14 October 2025 |
470.65 (-1.67%) |
478.65 |
469.80 - 482.45 |
0.6501 times |
Mon 13 October 2025 |
478.65 (-1.58%) |
483.95 |
477.00 - 483.95 |
0.4644 times |
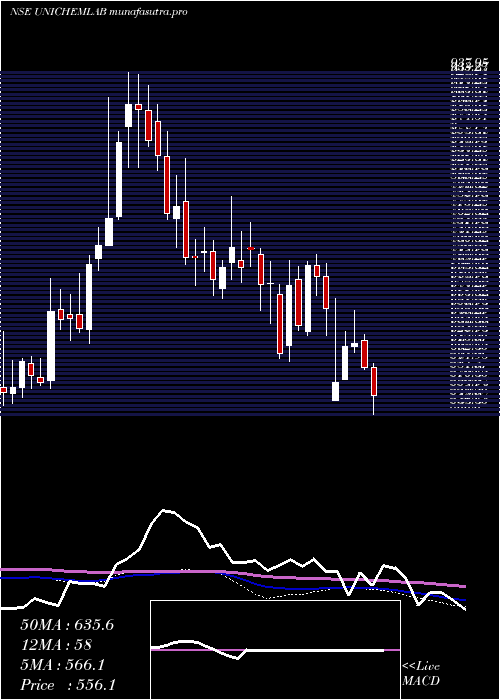
Weekly price and charts UnichemLaboratories Strong weekly Stock price targets for UnichemLaboratories UNICHEMLAB are 456.18 and 470.28 | Weekly Target 1 | 453.05 | | Weekly Target 2 | 459.3 | | Weekly Target 3 | 467.15 | | Weekly Target 4 | 473.4 | | Weekly Target 5 | 481.25 |
Weekly price and volumes for Unichem Laboratories
| Date |
Closing |
Open |
Range |
Volume |
Tue 28 October 2025 |
465.55 (-0.76%) |
473.80 |
460.90 - 475.00 |
0.1564 times |
Fri 24 October 2025 |
469.10 (0.78%) |
469.30 |
461.50 - 475.00 |
0.3156 times |
Fri 17 October 2025 |
465.45 (-4.3%) |
483.95 |
459.95 - 483.95 |
0.596 times |
Fri 10 October 2025 |
486.35 (-1.2%) |
493.40 |
465.00 - 493.40 |
1.0812 times |
Fri 03 October 2025 |
492.25 (2.79%) |
483.00 |
455.55 - 494.00 |
0.7321 times |
Fri 26 September 2025 |
478.90 (-4.78%) |
503.00 |
477.00 - 511.00 |
0.6182 times |
Fri 19 September 2025 |
502.95 (-0.68%) |
506.40 |
482.00 - 515.00 |
2.4602 times |
Fri 12 September 2025 |
506.40 (1.28%) |
499.40 |
490.00 - 510.00 |
1.0136 times |
Fri 05 September 2025 |
500.00 (-0.75%) |
503.80 |
496.05 - 512.50 |
0.716 times |
Fri 29 August 2025 |
503.80 (0.2%) |
507.85 |
498.05 - 557.55 |
2.3108 times |
Fri 22 August 2025 |
502.80 (-0.09%) |
510.00 |
496.25 - 517.45 |
0.6286 times |
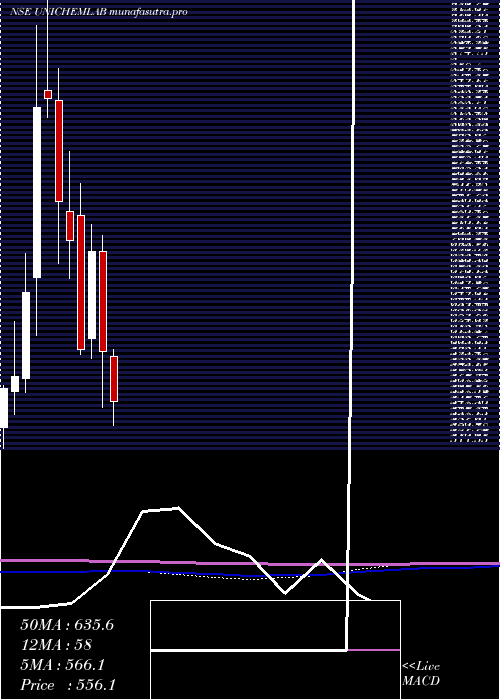
Monthly price and charts UnichemLaboratories Strong monthly Stock price targets for UnichemLaboratories UNICHEMLAB are 462.33 and 497.23 | Monthly Target 1 | 437.98 | | Monthly Target 2 | 451.77 | | Monthly Target 3 | 472.88333333333 | | Monthly Target 4 | 486.67 | | Monthly Target 5 | 507.78 |
Monthly price and volumes Unichem Laboratories
| Date |
Closing |
Open |
Range |
Volume |
Tue 28 October 2025 |
465.55 (0.9%) |
460.10 |
459.10 - 494.00 |
0.2354 times |
Tue 30 September 2025 |
461.40 (-8.42%) |
503.80 |
455.55 - 515.00 |
0.497 times |
Fri 29 August 2025 |
503.80 (-19.19%) |
629.70 |
483.00 - 629.70 |
0.9816 times |
Thu 31 July 2025 |
623.45 (5.8%) |
594.60 |
582.35 - 657.95 |
1.3193 times |
Mon 30 June 2025 |
589.30 (-1.49%) |
590.05 |
550.10 - 666.60 |
1.1163 times |
Fri 30 May 2025 |
598.20 (-0.7%) |
598.00 |
533.30 - 668.00 |
1.8379 times |
Wed 30 April 2025 |
602.40 (-13.56%) |
696.80 |
550.25 - 711.55 |
1.3368 times |
Fri 28 March 2025 |
696.90 (15.2%) |
615.00 |
596.05 - 722.35 |
0.7016 times |
Fri 28 February 2025 |
604.95 (-14.4%) |
730.00 |
600.00 - 760.00 |
1.4243 times |
Fri 31 January 2025 |
706.70 (-4.98%) |
733.70 |
671.00 - 790.70 |
0.5499 times |
Tue 31 December 2024 |
743.75 (-11.45%) |
838.05 |
685.50 - 867.85 |
0.761 times |
DMA SMA EMA moving averages of Unichem Laboratories UNICHEMLAB
DMA (daily moving average) of Unichem Laboratories UNICHEMLAB
| DMA period | DMA value | | 5 day DMA | 467.28 | | 12 day DMA | 470.66 | | 20 day DMA | 473.81 | | 35 day DMA | 484.34 | | 50 day DMA | 491.08 | | 100 day DMA | 541.99 | | 150 day DMA | 567.76 | | 200 day DMA | 597.68 | EMA (exponential moving average) of Unichem Laboratories UNICHEMLAB
| EMA period | EMA current | EMA prev | EMA prev2 | | 5 day EMA | 467.71 | 468.79 | 468.13 | | 12 day EMA | 470.68 | 471.61 | 471.89 | | 20 day EMA | 474.82 | 475.8 | 476.4 | | 35 day EMA | 481.93 | 482.89 | 483.64 | | 50 day EMA | 489.59 | 490.57 | 491.41 |
SMA (simple moving average) of Unichem Laboratories UNICHEMLAB
| SMA period | SMA current | SMA prev | SMA prev2 | | 5 day SMA | 467.28 | 467.37 | 466.44 | | 12 day SMA | 470.66 | 472.53 | 472.45 | | 20 day SMA | 473.81 | 474.48 | 475.31 | | 35 day SMA | 484.34 | 485.32 | 486.22 | | 50 day SMA | 491.08 | 492.05 | 492.33 | | 100 day SMA | 541.99 | 543.26 | 544.58 | | 150 day SMA | 567.76 | 569.04 | 570.15 | | 200 day SMA | 597.68 | 598.89 | 600.17 |
|
|
