Uflex UFLEX full analysis,charts,indicators,moving averages,SMA,DMA,EMA,ADX,MACD,RSIUflex UFLEX WideScreen charts, DMA,SMA,EMA technical analysis, forecast prediction, by indicators ADX,MACD,RSI,CCI NSE stock exchange
operates under Containers & Packaging sector
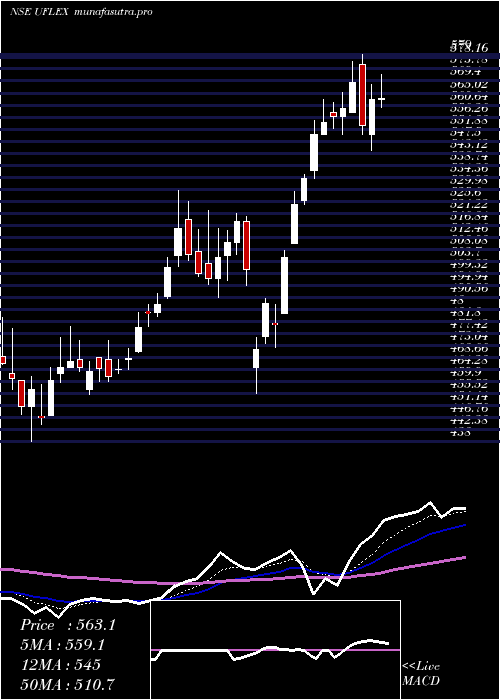
Daily price and charts and targets Uflex Strong Daily Stock price targets for Uflex UFLEX are 544.3 and 553.05 | Daily Target 1 | 542.62 | | Daily Target 2 | 545.98 | | Daily Target 3 | 551.36666666667 | | Daily Target 4 | 554.73 | | Daily Target 5 | 560.12 |
Daily price and volume Uflex
| Date |
Closing |
Open |
Range |
Volume |
Tue 28 October 2025 |
549.35 (0.2%) |
549.95 |
548.00 - 556.75 |
0.947 times |
Mon 27 October 2025 |
548.25 (-0.19%) |
548.00 |
545.20 - 554.80 |
1.1891 times |
Fri 24 October 2025 |
549.30 (0.36%) |
547.35 |
545.30 - 553.00 |
0.7456 times |
Thu 23 October 2025 |
547.35 (-1.03%) |
565.00 |
547.05 - 565.00 |
1.8854 times |
Tue 21 October 2025 |
553.05 (0.43%) |
551.05 |
551.05 - 557.25 |
0.752 times |
Mon 20 October 2025 |
550.70 (0.72%) |
547.05 |
546.30 - 557.65 |
1.006 times |
Fri 17 October 2025 |
546.75 (-0.23%) |
552.90 |
545.75 - 552.90 |
0.7579 times |
Thu 16 October 2025 |
548.00 (0.67%) |
545.50 |
545.50 - 556.30 |
0.7575 times |
Wed 15 October 2025 |
544.35 (0.09%) |
542.30 |
542.00 - 549.30 |
1.0382 times |
Tue 14 October 2025 |
543.85 (-1.35%) |
552.30 |
542.30 - 556.75 |
0.9214 times |
Mon 13 October 2025 |
551.30 (-1.19%) |
552.90 |
548.00 - 557.35 |
1.1049 times |
Weekly price and charts Uflex Strong weekly Stock price targets for Uflex UFLEX are 547.28 and 558.83 | Weekly Target 1 | 538.88 | | Weekly Target 2 | 544.12 | | Weekly Target 3 | 550.43333333333 | | Weekly Target 4 | 555.67 | | Weekly Target 5 | 561.98 |
Weekly price and volumes for Uflex
| Date |
Closing |
Open |
Range |
Volume |
Tue 28 October 2025 |
549.35 (0.01%) |
548.00 |
545.20 - 556.75 |
0.2197 times |
Fri 24 October 2025 |
549.30 (0.47%) |
547.05 |
545.30 - 565.00 |
0.4515 times |
Fri 17 October 2025 |
546.75 (-2.01%) |
552.90 |
542.00 - 557.35 |
0.4711 times |
Fri 10 October 2025 |
557.95 (0.79%) |
559.00 |
543.00 - 588.00 |
3.1723 times |
Fri 03 October 2025 |
553.55 (2.23%) |
549.00 |
540.00 - 558.80 |
0.3043 times |
Fri 26 September 2025 |
541.45 (-2.19%) |
553.00 |
540.00 - 556.40 |
0.4121 times |
Fri 19 September 2025 |
553.55 (-0.33%) |
553.00 |
548.15 - 563.20 |
0.5813 times |
Fri 12 September 2025 |
555.40 (0.81%) |
552.50 |
550.00 - 561.00 |
0.5481 times |
Fri 05 September 2025 |
550.95 (6.64%) |
519.90 |
519.90 - 577.70 |
2.4412 times |
Fri 29 August 2025 |
516.65 (-5.24%) |
546.20 |
510.10 - 552.00 |
1.3983 times |
Fri 22 August 2025 |
545.20 (-6.01%) |
583.00 |
536.40 - 595.40 |
2.9916 times |
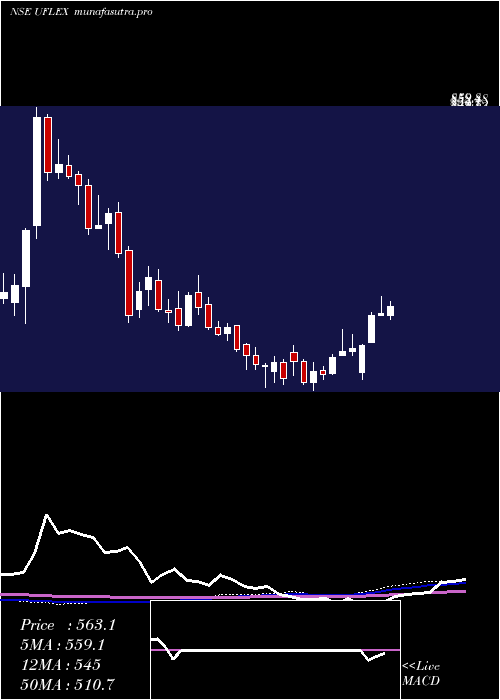
Monthly price and charts Uflex Strong monthly Stock price targets for Uflex UFLEX are 545.48 and 591.88 | Monthly Target 1 | 513.25 | | Monthly Target 2 | 531.3 | | Monthly Target 3 | 559.65 | | Monthly Target 4 | 577.7 | | Monthly Target 5 | 606.05 |
Monthly price and volumes Uflex
| Date |
Closing |
Open |
Range |
Volume |
Tue 28 October 2025 |
549.35 (1.32%) |
546.50 |
541.60 - 588.00 |
0.5388 times |
Tue 30 September 2025 |
542.20 (4.95%) |
519.90 |
519.90 - 577.70 |
0.4819 times |
Fri 29 August 2025 |
516.65 (-12.66%) |
595.95 |
510.10 - 602.80 |
0.7139 times |
Thu 31 July 2025 |
591.55 (-2.86%) |
614.95 |
582.15 - 620.00 |
0.364 times |
Mon 30 June 2025 |
608.95 (-0.85%) |
614.00 |
581.85 - 648.00 |
0.9528 times |
Fri 30 May 2025 |
614.15 (11.17%) |
552.45 |
520.70 - 685.60 |
2.1686 times |
Wed 30 April 2025 |
552.45 (11.08%) |
497.35 |
455.60 - 579.00 |
1.0922 times |
Fri 28 March 2025 |
497.35 (10.31%) |
450.85 |
438.00 - 529.65 |
1.5872 times |
Fri 28 February 2025 |
450.85 (-5.24%) |
467.15 |
448.00 - 505.95 |
1.3074 times |
Fri 31 January 2025 |
475.80 (-8.54%) |
522.90 |
443.05 - 538.05 |
0.7932 times |
Tue 31 December 2024 |
520.25 (-2.92%) |
535.90 |
513.20 - 610.00 |
1.7173 times |

DMA SMA EMA moving averages of Uflex UFLEX
DMA (daily moving average) of Uflex UFLEX
| DMA period | DMA value | | 5 day DMA | 549.46 | | 12 day DMA | 549.18 | | 20 day DMA | 550.44 | | 35 day DMA | 551.06 | | 50 day DMA | 549.91 | | 100 day DMA | 575.16 | | 150 day DMA | 568.66 | | 200 day DMA | 545.1 | EMA (exponential moving average) of Uflex UFLEX
| EMA period | EMA current | EMA prev | EMA prev2 | | 5 day EMA | 549.07 | 548.93 | 549.27 | | 12 day EMA | 549.49 | 549.52 | 549.75 | | 20 day EMA | 550.12 | 550.2 | 550.4 | | 35 day EMA | 551.64 | 551.77 | 551.98 | | 50 day EMA | 552.88 | 553.02 | 553.21 |
SMA (simple moving average) of Uflex UFLEX
| SMA period | SMA current | SMA prev | SMA prev2 | | 5 day SMA | 549.46 | 549.73 | 549.43 | | 12 day SMA | 549.18 | 549.29 | 549.63 | | 20 day SMA | 550.44 | 550.04 | 549.98 | | 35 day SMA | 551.06 | 551.11 | 551.2 | | 50 day SMA | 549.91 | 550.64 | 551.46 | | 100 day SMA | 575.16 | 575.95 | 576.76 | | 150 day SMA | 568.66 | 568.2 | 567.66 | | 200 day SMA | 545.1 | 544.92 | 544.84 |
|
|
