UcoBank UCOBANK full analysis,charts,indicators,moving averages,SMA,DMA,EMA,ADX,MACD,RSIUco Bank UCOBANK WideScreen charts, DMA,SMA,EMA technical analysis, forecast prediction, by indicators ADX,MACD,RSI,CCI NSE stock exchange
operates under Banks sector
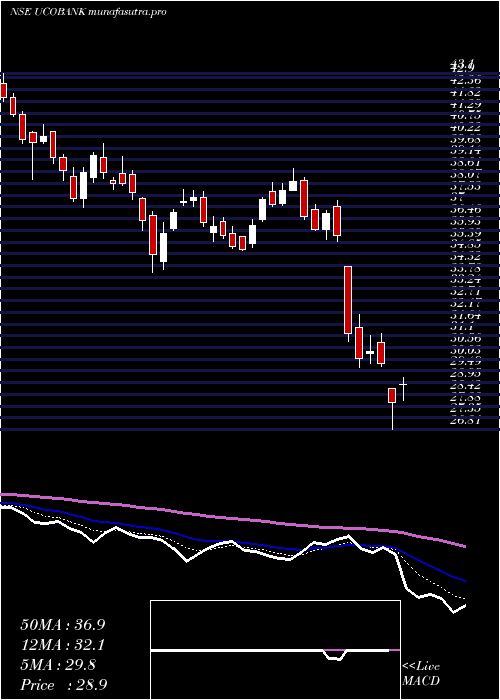
Daily price and charts and targets UcoBank Strong Daily Stock price targets for UcoBank UCOBANK are 29.08 and 29.6 | Daily Target 1 | 28.95 | | Daily Target 2 | 29.21 | | Daily Target 3 | 29.473333333333 | | Daily Target 4 | 29.73 | | Daily Target 5 | 29.99 |
Daily price and volume Uco Bank
| Date |
Closing |
Open |
Range |
Volume |
Fri 05 December 2025 |
29.46 (-0.71%) |
29.67 |
29.22 - 29.74 |
1.0591 times |
Thu 04 December 2025 |
29.67 (-0.93%) |
29.90 |
29.46 - 30.14 |
1.0007 times |
Wed 03 December 2025 |
29.95 (-2.12%) |
30.61 |
29.81 - 30.67 |
1.125 times |
Tue 02 December 2025 |
30.60 (-0.62%) |
30.70 |
30.52 - 31.16 |
0.8279 times |
Mon 01 December 2025 |
30.79 (0.03%) |
31.01 |
30.68 - 31.20 |
0.8924 times |
Fri 28 November 2025 |
30.78 (-0.81%) |
31.02 |
30.73 - 31.06 |
0.5848 times |
Thu 27 November 2025 |
31.03 (-0.26%) |
31.25 |
30.85 - 31.41 |
0.7371 times |
Wed 26 November 2025 |
31.11 (1.53%) |
30.79 |
30.65 - 31.75 |
1.5662 times |
Tue 25 November 2025 |
30.64 (-0.16%) |
30.69 |
30.30 - 30.95 |
1.2108 times |
Mon 24 November 2025 |
30.69 (-0.03%) |
30.92 |
30.50 - 31.22 |
0.9961 times |
Fri 21 November 2025 |
30.70 (-1.13%) |
31.20 |
30.60 - 31.30 |
0.8239 times |
Weekly price and charts UcoBank Strong weekly Stock price targets for UcoBank UCOBANK are 28.35 and 30.33 | Weekly Target 1 | 27.98 | | Weekly Target 2 | 28.72 | | Weekly Target 3 | 29.96 | | Weekly Target 4 | 30.7 | | Weekly Target 5 | 31.94 |
Weekly price and volumes for Uco Bank
| Date |
Closing |
Open |
Range |
Volume |
Fri 05 December 2025 |
29.46 (-4.29%) |
31.01 |
29.22 - 31.20 |
0.6417 times |
Fri 28 November 2025 |
30.78 (0.26%) |
30.92 |
30.30 - 31.75 |
0.6665 times |
Fri 21 November 2025 |
30.70 (-0.07%) |
30.88 |
30.60 - 32.12 |
1.1076 times |
Fri 14 November 2025 |
30.72 (-5.54%) |
32.70 |
30.58 - 32.70 |
0.8542 times |
Fri 07 November 2025 |
32.52 (-2.08%) |
33.36 |
31.41 - 34.19 |
0.9512 times |
Fri 31 October 2025 |
33.21 (4.9%) |
31.70 |
31.61 - 34.20 |
1.535 times |
Fri 24 October 2025 |
31.66 (2.49%) |
30.96 |
30.53 - 33.25 |
1.1833 times |
Fri 17 October 2025 |
30.89 (-2.86%) |
31.65 |
30.70 - 32.20 |
0.9981 times |
Fri 10 October 2025 |
31.80 (3.35%) |
31.35 |
30.47 - 32.25 |
1.3055 times |
Fri 03 October 2025 |
30.77 (4.52%) |
29.58 |
29.29 - 30.99 |
0.757 times |
Fri 26 September 2025 |
29.44 (-5.19%) |
31.09 |
29.14 - 31.52 |
0.8327 times |
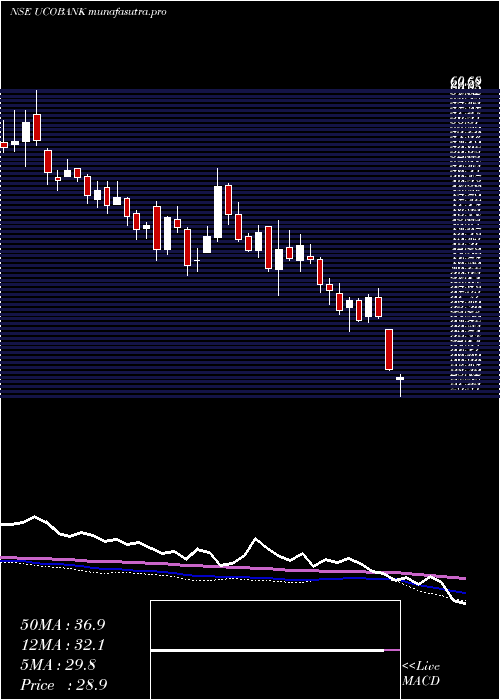
Monthly price and charts UcoBank Strong monthly Stock price targets for UcoBank UCOBANK are 28.35 and 30.33 | Monthly Target 1 | 27.98 | | Monthly Target 2 | 28.72 | | Monthly Target 3 | 29.96 | | Monthly Target 4 | 30.7 | | Monthly Target 5 | 31.94 |
Monthly price and volumes Uco Bank
| Date |
Closing |
Open |
Range |
Volume |
Fri 05 December 2025 |
29.46 (-4.29%) |
31.01 |
29.22 - 31.20 |
0.161 times |
Fri 28 November 2025 |
30.78 (-7.32%) |
33.36 |
30.30 - 34.19 |
0.8979 times |
Fri 31 October 2025 |
33.21 (8.92%) |
30.72 |
30.27 - 34.20 |
1.3323 times |
Tue 30 September 2025 |
30.49 (8.12%) |
28.18 |
27.92 - 31.52 |
0.8615 times |
Fri 29 August 2025 |
28.20 (-5.34%) |
29.50 |
27.80 - 29.89 |
0.5551 times |
Thu 31 July 2025 |
29.79 (-8.06%) |
32.70 |
29.43 - 33.29 |
0.8313 times |
Mon 30 June 2025 |
32.40 (-1.97%) |
33.50 |
29.16 - 35.08 |
2.1114 times |
Fri 30 May 2025 |
33.05 (6.44%) |
31.00 |
29.07 - 33.76 |
1.156 times |
Wed 30 April 2025 |
31.05 (-13.03%) |
34.27 |
26.81 - 34.27 |
1.6867 times |
Fri 28 March 2025 |
35.70 (-1.84%) |
36.60 |
34.01 - 38.76 |
0.4067 times |
Fri 28 February 2025 |
36.37 (-16.41%) |
42.30 |
35.90 - 43.57 |
0.31 times |

DMA SMA EMA moving averages of Uco Bank UCOBANK
DMA (daily moving average) of Uco Bank UCOBANK
| DMA period | DMA value | | 5 day DMA | 30.09 | | 12 day DMA | 30.54 | | 20 day DMA | 30.88 | | 35 day DMA | 31.49 | | 50 day DMA | 31.28 | | 100 day DMA | 30.44 | | 150 day DMA | 30.82 | | 200 day DMA | 31.72 | EMA (exponential moving average) of Uco Bank UCOBANK
| EMA period | EMA current | EMA prev | EMA prev2 | | 5 day EMA | 29.97 | 30.22 | 30.5 | | 12 day EMA | 30.47 | 30.65 | 30.83 | | 20 day EMA | 30.79 | 30.93 | 31.06 | | 35 day EMA | 30.92 | 31.01 | 31.09 | | 50 day EMA | 31.11 | 31.18 | 31.24 |
SMA (simple moving average) of Uco Bank UCOBANK
| SMA period | SMA current | SMA prev | SMA prev2 | | 5 day SMA | 30.09 | 30.36 | 30.63 | | 12 day SMA | 30.54 | 30.74 | 30.9 | | 20 day SMA | 30.88 | 31.03 | 31.14 | | 35 day SMA | 31.49 | 31.55 | 31.59 | | 50 day SMA | 31.28 | 31.31 | 31.33 | | 100 day SMA | 30.44 | 30.46 | 30.48 | | 150 day SMA | 30.82 | 30.84 | 30.85 | | 200 day SMA | 31.72 | 31.78 | 31.83 |
|
|
