Ucal UCAL full analysis,charts,indicators,moving averages,SMA,DMA,EMA,ADX,MACD,RSIUcal UCAL WideScreen charts, DMA,SMA,EMA technical analysis, forecast prediction, by indicators ADX,MACD,RSI,CCI NSE stock exchange
Daily price and charts and targets Ucal Strong Daily Stock price targets for Ucal UCAL are 125.77 and 128.86 | Daily Target 1 | 123.39 | | Daily Target 2 | 125.06 | | Daily Target 3 | 126.48 | | Daily Target 4 | 128.15 | | Daily Target 5 | 129.57 |
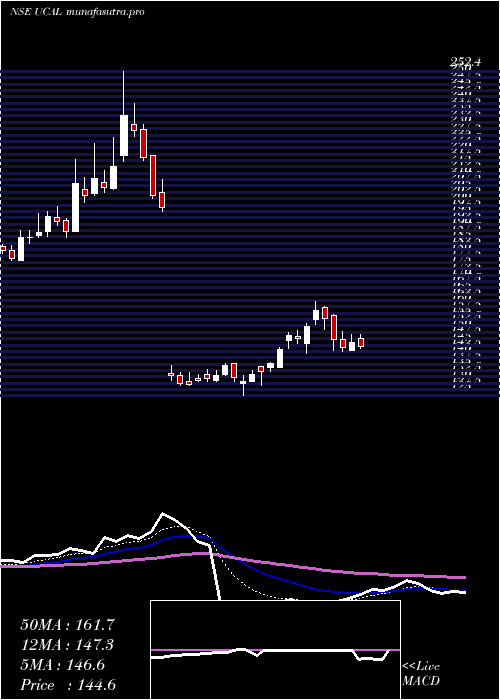
Daily price and volume Ucal
| Date |
Closing |
Open |
Range |
Volume |
Mon 27 October 2025 |
126.73 (1.76%) |
125.20 |
124.81 - 127.90 |
0.644 times |
Fri 24 October 2025 |
124.54 (1.88%) |
123.49 |
123.02 - 126.00 |
0.5938 times |
Thu 23 October 2025 |
122.24 (-4.04%) |
129.01 |
120.30 - 129.42 |
4.0258 times |
Tue 21 October 2025 |
127.39 (-1.52%) |
133.00 |
126.99 - 133.00 |
0.3355 times |
Mon 20 October 2025 |
129.36 (-0.71%) |
130.00 |
123.00 - 131.21 |
2.8745 times |
Fri 17 October 2025 |
130.28 (-1.84%) |
131.63 |
129.70 - 133.89 |
0.4316 times |
Thu 16 October 2025 |
132.72 (-1.45%) |
135.05 |
132.00 - 135.19 |
0.1901 times |
Wed 15 October 2025 |
134.67 (3.02%) |
131.59 |
129.90 - 135.70 |
0.4073 times |
Tue 14 October 2025 |
130.72 (-0.97%) |
131.90 |
130.50 - 132.38 |
0.2443 times |
Mon 13 October 2025 |
132.00 (-2.78%) |
135.98 |
131.26 - 136.07 |
0.2531 times |
Fri 10 October 2025 |
135.77 (2.08%) |
132.80 |
131.52 - 137.99 |
0.3815 times |
Weekly price and charts Ucal Strong weekly Stock price targets for Ucal UCAL are 125.77 and 128.86 | Weekly Target 1 | 123.39 | | Weekly Target 2 | 125.06 | | Weekly Target 3 | 126.48 | | Weekly Target 4 | 128.15 | | Weekly Target 5 | 129.57 |
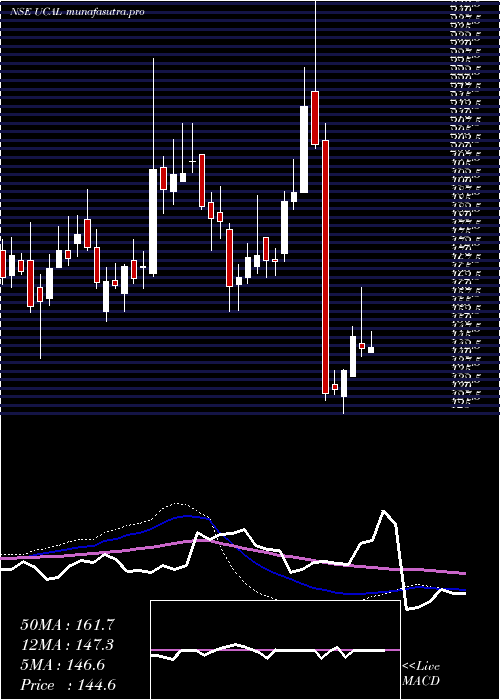
Weekly price and volumes for Ucal
| Date |
Closing |
Open |
Range |
Volume |
Mon 27 October 2025 |
126.73 (1.76%) |
125.20 |
124.81 - 127.90 |
0.2114 times |
Fri 24 October 2025 |
124.54 (-4.41%) |
130.00 |
120.30 - 133.00 |
2.5698 times |
Fri 17 October 2025 |
130.28 (-4.04%) |
135.98 |
129.70 - 136.07 |
0.501 times |
Fri 10 October 2025 |
135.77 (-1.04%) |
138.10 |
130.20 - 138.99 |
0.4835 times |
Fri 03 October 2025 |
137.19 (0.89%) |
135.14 |
135.14 - 142.18 |
0.6616 times |
Fri 26 September 2025 |
135.98 (-4.25%) |
145.00 |
135.05 - 145.00 |
0.9091 times |
Fri 19 September 2025 |
142.01 (3.43%) |
137.85 |
136.00 - 146.99 |
1.3323 times |
Fri 12 September 2025 |
137.30 (0.39%) |
138.99 |
132.20 - 142.99 |
1.4479 times |
Fri 05 September 2025 |
136.76 (0.94%) |
136.57 |
131.00 - 138.99 |
1.2968 times |
Fri 29 August 2025 |
135.48 (-0.71%) |
137.98 |
133.11 - 140.49 |
0.5865 times |
Fri 22 August 2025 |
136.45 (-1.02%) |
138.20 |
136.01 - 142.35 |
1.0529 times |
Monthly price and charts Ucal Strong monthly Stock price targets for Ucal UCAL are 113.84 and 133.2 | Monthly Target 1 | 109.54 | | Monthly Target 2 | 118.13 | | Monthly Target 3 | 128.89666666667 | | Monthly Target 4 | 137.49 | | Monthly Target 5 | 148.26 |
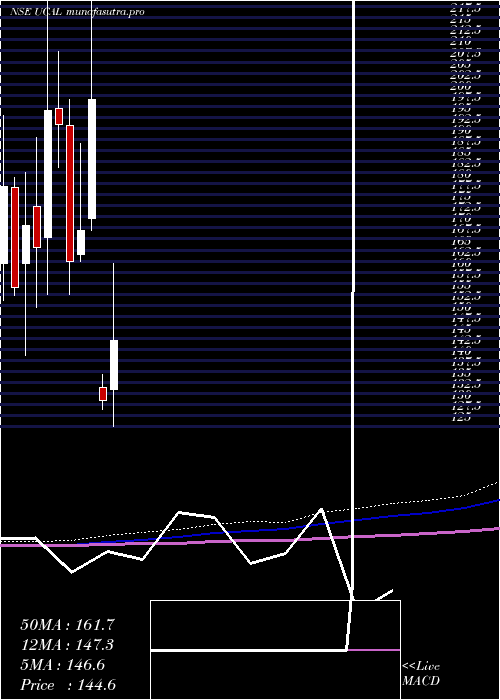
Monthly price and volumes Ucal
| Date |
Closing |
Open |
Range |
Volume |
Mon 27 October 2025 |
126.73 (-7%) |
138.96 |
120.30 - 139.66 |
0.2583 times |
Tue 30 September 2025 |
136.27 (0.58%) |
136.57 |
131.00 - 146.99 |
0.3671 times |
Fri 29 August 2025 |
135.48 (-8.04%) |
146.00 |
133.11 - 148.99 |
0.2405 times |
Thu 31 July 2025 |
147.32 (-5.33%) |
156.24 |
145.21 - 166.00 |
0.6073 times |
Mon 30 June 2025 |
155.61 (-6.19%) |
154.00 |
143.00 - 160.98 |
0.5863 times |
Fri 30 May 2025 |
165.87 (16.39%) |
141.20 |
135.63 - 171.00 |
0.3287 times |
Wed 30 April 2025 |
142.51 (8.87%) |
133.52 |
125.00 - 161.95 |
0.3163 times |
Fri 28 March 2025 |
130.90 (-34.25%) |
133.99 |
128.99 - 136.90 |
0.1065 times |
Mon 30 December 2024 |
199.09 (17.45%) |
172.00 |
169.50 - 252.40 |
6.849 times |
Fri 29 November 2024 |
169.51 (4.33%) |
164.09 |
162.49 - 189.00 |
0.3402 times |
Thu 31 October 2024 |
162.48 (-15.93%) |
193.07 |
155.03 - 199.10 |
0.5027 times |
DMA SMA EMA moving averages of Ucal UCAL
DMA (daily moving average) of Ucal UCAL
| DMA period | DMA value | | 5 day DMA | 126.05 | | 12 day DMA | 129.95 | | 20 day DMA | 132.4 | | 35 day DMA | 135.44 | | 50 day DMA | 135.85 | | 100 day DMA | 143.39 | | 150 day DMA | 146.59 | | 200 day DMA | 154.64 | EMA (exponential moving average) of Ucal UCAL
| EMA period | EMA current | EMA prev | EMA prev2 | | 5 day EMA | 126.54 | 126.44 | 127.39 | | 12 day EMA | 129.27 | 129.73 | 130.67 | | 20 day EMA | 131.41 | 131.9 | 132.67 | | 35 day EMA | 133.44 | 133.84 | 134.39 | | 50 day EMA | 135.28 | 135.63 | 136.08 |
SMA (simple moving average) of Ucal UCAL
| SMA period | SMA current | SMA prev | SMA prev2 | | 5 day SMA | 126.05 | 126.76 | 128.4 | | 12 day SMA | 129.95 | 130.46 | 131.16 | | 20 day SMA | 132.4 | 133 | 133.84 | | 35 day SMA | 135.44 | 135.64 | 135.93 | | 50 day SMA | 135.85 | 136.17 | 136.57 | | 100 day SMA | 143.39 | 143.61 | 143.86 | | 150 day SMA | 146.59 | 147.31 | 147.92 | | 200 day SMA | 154.64 | 154.93 | 155.21 |
|
|
