TvToday TVTODAY full analysis,charts,indicators,moving averages,SMA,DMA,EMA,ADX,MACD,RSITv Today TVTODAY WideScreen charts, DMA,SMA,EMA technical analysis, forecast prediction, by indicators ADX,MACD,RSI,CCI NSE stock exchange
operates under Broadcasting & Cable TV sector
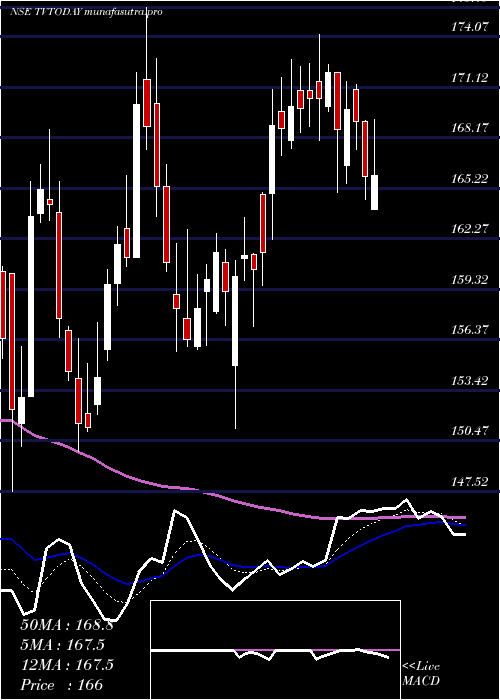
Daily price and charts and targets TvToday Strong Daily Stock price targets for TvToday TVTODAY are 146.8 and 148.5 | Daily Target 1 | 145.5 | | Daily Target 2 | 146.39 | | Daily Target 3 | 147.19666666667 | | Daily Target 4 | 148.09 | | Daily Target 5 | 148.9 |
Daily price and volume Tv Today
| Date |
Closing |
Open |
Range |
Volume |
Tue 28 October 2025 |
147.29 (-0.16%) |
146.30 |
146.30 - 148.00 |
0.446 times |
Mon 27 October 2025 |
147.53 (-0.85%) |
147.53 |
146.71 - 148.79 |
0.5452 times |
Fri 24 October 2025 |
148.79 (-0.97%) |
148.15 |
147.12 - 150.19 |
0.4855 times |
Thu 23 October 2025 |
150.25 (1.95%) |
147.38 |
141.80 - 152.12 |
1.9087 times |
Tue 21 October 2025 |
147.38 (0.5%) |
146.00 |
145.50 - 148.00 |
0.3183 times |
Mon 20 October 2025 |
146.64 (0.68%) |
146.80 |
144.73 - 149.78 |
0.7219 times |
Fri 17 October 2025 |
145.65 (-0.69%) |
147.50 |
144.99 - 147.51 |
0.4448 times |
Thu 16 October 2025 |
146.66 (0.38%) |
145.60 |
145.35 - 147.95 |
0.5687 times |
Wed 15 October 2025 |
146.10 (0.77%) |
144.25 |
144.25 - 146.50 |
4.0411 times |
Tue 14 October 2025 |
144.98 (-1.64%) |
148.70 |
144.00 - 148.70 |
0.5198 times |
Mon 13 October 2025 |
147.40 (0.35%) |
146.50 |
145.71 - 151.00 |
0.8039 times |
Weekly price and charts TvToday Strong weekly Stock price targets for TvToday TVTODAY are 145.55 and 148.04 | Weekly Target 1 | 144.97 | | Weekly Target 2 | 146.13 | | Weekly Target 3 | 147.46 | | Weekly Target 4 | 148.62 | | Weekly Target 5 | 149.95 |
Weekly price and volumes for Tv Today
| Date |
Closing |
Open |
Range |
Volume |
Tue 28 October 2025 |
147.29 (-1.01%) |
147.53 |
146.30 - 148.79 |
0.1586 times |
Fri 24 October 2025 |
148.79 (2.16%) |
146.80 |
141.80 - 152.12 |
0.5497 times |
Fri 17 October 2025 |
145.65 (-0.84%) |
146.50 |
144.00 - 151.00 |
1.0208 times |
Fri 10 October 2025 |
146.89 (-1.65%) |
149.20 |
146.00 - 153.01 |
0.6834 times |
Fri 03 October 2025 |
149.36 (3.75%) |
143.50 |
141.12 - 151.12 |
0.7734 times |
Fri 26 September 2025 |
143.96 (-4.29%) |
150.42 |
141.15 - 153.42 |
1.3367 times |
Fri 19 September 2025 |
150.42 (-0.86%) |
151.46 |
150.15 - 154.29 |
1.2021 times |
Fri 12 September 2025 |
151.72 (-0.37%) |
153.35 |
147.60 - 156.48 |
1.8379 times |
Fri 05 September 2025 |
152.28 (3.18%) |
147.59 |
147.41 - 154.49 |
1.1481 times |
Fri 29 August 2025 |
147.59 (0.05%) |
147.58 |
144.00 - 152.80 |
1.2892 times |
Fri 22 August 2025 |
147.52 (-0.33%) |
149.10 |
145.51 - 150.31 |
1.1236 times |

Monthly price and charts TvToday Strong monthly Stock price targets for TvToday TVTODAY are 138.94 and 150.15 | Monthly Target 1 | 136.16 | | Monthly Target 2 | 141.72 | | Monthly Target 3 | 147.36666666667 | | Monthly Target 4 | 152.93 | | Monthly Target 5 | 158.58 |
Monthly price and volumes Tv Today
| Date |
Closing |
Open |
Range |
Volume |
Tue 28 October 2025 |
147.29 (-0.45%) |
149.00 |
141.80 - 153.01 |
0.3115 times |
Tue 30 September 2025 |
147.95 (0.24%) |
147.59 |
141.12 - 156.48 |
0.6905 times |
Fri 29 August 2025 |
147.59 (-4.17%) |
152.90 |
139.92 - 155.00 |
0.7538 times |
Thu 31 July 2025 |
154.02 (-10.96%) |
173.25 |
151.49 - 176.55 |
0.9729 times |
Mon 30 June 2025 |
172.97 (0.55%) |
170.90 |
161.01 - 182.60 |
0.8764 times |
Fri 30 May 2025 |
172.02 (3.66%) |
164.00 |
160.25 - 184.80 |
1.0296 times |
Wed 30 April 2025 |
165.94 (6.09%) |
156.00 |
151.21 - 174.20 |
0.7362 times |
Fri 28 March 2025 |
156.42 (-0.01%) |
160.25 |
147.52 - 175.79 |
1.7111 times |
Fri 28 February 2025 |
156.43 (-18.77%) |
190.00 |
155.30 - 201.00 |
0.9324 times |
Fri 31 January 2025 |
192.58 (-6.67%) |
206.35 |
180.00 - 226.99 |
1.9854 times |
Tue 31 December 2024 |
206.35 (1.99%) |
201.79 |
194.61 - 216.99 |
0.7982 times |
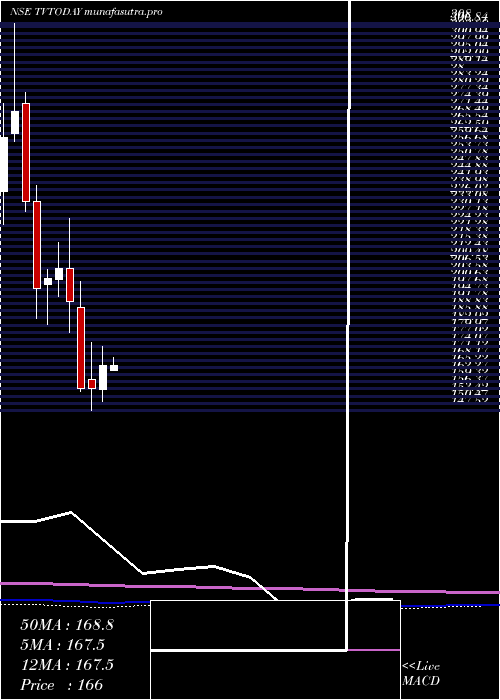
DMA SMA EMA moving averages of Tv Today TVTODAY
DMA (daily moving average) of Tv Today TVTODAY
| DMA period | DMA value | | 5 day DMA | 148.25 | | 12 day DMA | 147.13 | | 20 day DMA | 147.63 | | 35 day DMA | 148.91 | | 50 day DMA | 148.92 | | 100 day DMA | 156.92 | | 150 day DMA | 160.65 | | 200 day DMA | 165.31 | EMA (exponential moving average) of Tv Today TVTODAY
| EMA period | EMA current | EMA prev | EMA prev2 | | 5 day EMA | 147.75 | 147.98 | 148.2 | | 12 day EMA | 147.65 | 147.72 | 147.76 | | 20 day EMA | 147.78 | 147.83 | 147.86 | | 35 day EMA | 147.98 | 148.02 | 148.05 | | 50 day EMA | 148.36 | 148.4 | 148.44 |
SMA (simple moving average) of Tv Today TVTODAY
| SMA period | SMA current | SMA prev | SMA prev2 | | 5 day SMA | 148.25 | 148.12 | 147.74 | | 12 day SMA | 147.13 | 147.15 | 147.28 | | 20 day SMA | 147.63 | 147.46 | 147.37 | | 35 day SMA | 148.91 | 149.05 | 149.17 | | 50 day SMA | 148.92 | 148.86 | 148.81 | | 100 day SMA | 156.92 | 157.14 | 157.36 | | 150 day SMA | 160.65 | 160.75 | 160.83 | | 200 day SMA | 165.31 | 165.61 | 165.95 |
|
|
