TvsSupply TVSSCS full analysis,charts,indicators,moving averages,SMA,DMA,EMA,ADX,MACD,RSITvs Supply TVSSCS WideScreen charts, DMA,SMA,EMA technical analysis, forecast prediction, by indicators ADX,MACD,RSI,CCI NSE stock exchange
Daily price and charts and targets TvsSupply Strong Daily Stock price targets for TvsSupply TVSSCS are 127.79 and 132.28 | Daily Target 1 | 124.1 | | Daily Target 2 | 126.99 | | Daily Target 3 | 128.59 | | Daily Target 4 | 131.48 | | Daily Target 5 | 133.08 |
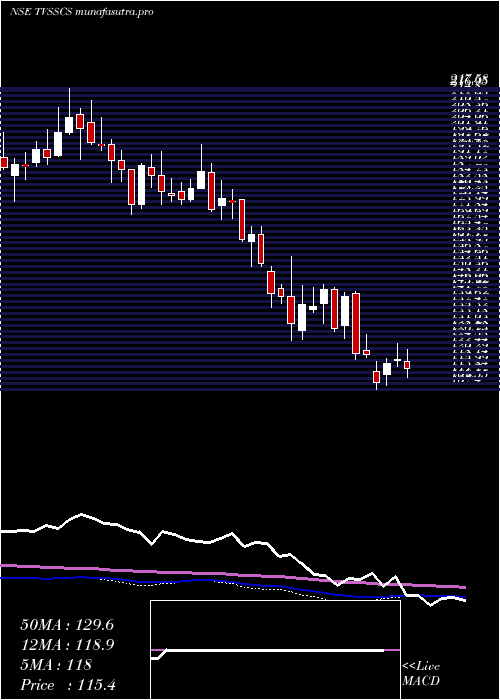
Daily price and volume Tvs Supply
| Date |
Closing |
Open |
Range |
Volume |
Wed 29 October 2025 |
129.88 (2.5%) |
126.71 |
125.70 - 130.19 |
1.9007 times |
Tue 28 October 2025 |
126.71 (-0.53%) |
127.05 |
126.00 - 128.52 |
0.6314 times |
Mon 27 October 2025 |
127.38 (-0.16%) |
127.51 |
125.60 - 128.70 |
0.8312 times |
Fri 24 October 2025 |
127.59 (-1.31%) |
129.30 |
127.00 - 130.50 |
0.7247 times |
Thu 23 October 2025 |
129.28 (1.81%) |
127.09 |
126.00 - 132.70 |
3.4254 times |
Tue 21 October 2025 |
126.98 (1.45%) |
126.17 |
125.50 - 128.50 |
0.4297 times |
Mon 20 October 2025 |
125.16 (0.99%) |
125.20 |
122.90 - 125.90 |
0.5387 times |
Fri 17 October 2025 |
123.93 (-1.44%) |
125.50 |
123.30 - 126.18 |
0.4607 times |
Thu 16 October 2025 |
125.74 (0.54%) |
125.45 |
124.51 - 126.59 |
0.5276 times |
Wed 15 October 2025 |
125.07 (0.3%) |
125.10 |
124.04 - 125.80 |
0.5298 times |
Tue 14 October 2025 |
124.69 (-0.94%) |
125.87 |
123.75 - 127.02 |
0.7136 times |

Weekly price and charts TvsSupply Strong weekly Stock price targets for TvsSupply TVSSCS are 127.74 and 132.33 | Weekly Target 1 | 123.97 | | Weekly Target 2 | 126.92 | | Weekly Target 3 | 128.55666666667 | | Weekly Target 4 | 131.51 | | Weekly Target 5 | 133.15 |
Weekly price and volumes for Tvs Supply
| Date |
Closing |
Open |
Range |
Volume |
Wed 29 October 2025 |
129.88 (1.79%) |
127.51 |
125.60 - 130.19 |
0.6207 times |
Fri 24 October 2025 |
127.59 (2.95%) |
125.20 |
122.90 - 132.70 |
0.9447 times |
Fri 17 October 2025 |
123.93 (-0.97%) |
124.15 |
123.30 - 127.02 |
0.5477 times |
Fri 10 October 2025 |
125.14 (-1.74%) |
127.19 |
123.50 - 128.62 |
0.742 times |
Fri 03 October 2025 |
127.36 (2.88%) |
124.50 |
122.80 - 130.81 |
1.0495 times |
Fri 26 September 2025 |
123.80 (-5.73%) |
131.50 |
123.00 - 132.50 |
0.7625 times |
Fri 19 September 2025 |
131.32 (-0.62%) |
132.10 |
130.78 - 138.00 |
1.6119 times |
Fri 12 September 2025 |
132.14 (0.55%) |
131.45 |
130.00 - 135.40 |
0.9628 times |
Fri 05 September 2025 |
131.42 (7.22%) |
122.57 |
122.57 - 136.39 |
1.96 times |
Fri 29 August 2025 |
122.57 (-7.06%) |
132.20 |
121.21 - 133.19 |
0.7984 times |
Fri 22 August 2025 |
131.88 (-0.43%) |
134.00 |
131.10 - 135.45 |
0.7912 times |
Monthly price and charts TvsSupply Strong monthly Stock price targets for TvsSupply TVSSCS are 126.39 and 136.19 | Monthly Target 1 | 118.69 | | Monthly Target 2 | 124.29 | | Monthly Target 3 | 128.49333333333 | | Monthly Target 4 | 134.09 | | Monthly Target 5 | 138.29 |
Monthly price and volumes Tvs Supply
| Date |
Closing |
Open |
Range |
Volume |
Wed 29 October 2025 |
129.88 (4.46%) |
128.60 |
122.90 - 132.70 |
0.4849 times |
Tue 30 September 2025 |
124.34 (1.44%) |
122.57 |
122.57 - 138.00 |
0.7597 times |
Fri 29 August 2025 |
122.57 (-4.69%) |
127.40 |
121.21 - 138.15 |
1.0061 times |
Thu 31 July 2025 |
128.60 (-5.76%) |
136.99 |
125.20 - 137.90 |
0.5823 times |
Mon 30 June 2025 |
136.46 (8.1%) |
126.40 |
125.40 - 147.00 |
1.3886 times |
Fri 30 May 2025 |
126.24 (9.44%) |
115.00 |
110.00 - 134.00 |
0.7157 times |
Wed 30 April 2025 |
115.35 (-4.47%) |
121.75 |
107.40 - 127.70 |
0.8986 times |
Fri 28 March 2025 |
120.75 (-12.32%) |
138.80 |
118.36 - 145.90 |
1.581 times |
Fri 28 February 2025 |
137.71 (-3.5%) |
144.51 |
125.30 - 156.25 |
2.0334 times |
Fri 31 January 2025 |
142.71 (-20.21%) |
177.72 |
137.40 - 180.72 |
0.5496 times |
Tue 31 December 2024 |
178.85 (1.09%) |
177.07 |
169.60 - 196.90 |
1.0479 times |

DMA SMA EMA moving averages of Tvs Supply TVSSCS
DMA (daily moving average) of Tvs Supply TVSSCS
| DMA period | DMA value | | 5 day DMA | 128.17 | | 12 day DMA | 126.52 | | 20 day DMA | 126.18 | | 35 day DMA | 128.11 | | 50 day DMA | 128.71 | | 100 day DMA | 130.6 | | 150 day DMA | 128.22 | | 200 day DMA | 132.14 | EMA (exponential moving average) of Tvs Supply TVSSCS
| EMA period | EMA current | EMA prev | EMA prev2 | | 5 day EMA | 127.98 | 127.03 | 127.19 | | 12 day EMA | 127.13 | 126.63 | 126.62 | | 20 day EMA | 127.11 | 126.82 | 126.83 | | 35 day EMA | 127.75 | 127.62 | 127.67 | | 50 day EMA | 128.85 | 128.81 | 128.9 |
SMA (simple moving average) of Tvs Supply TVSSCS
| SMA period | SMA current | SMA prev | SMA prev2 | | 5 day SMA | 128.17 | 127.59 | 127.28 | | 12 day SMA | 126.52 | 126.13 | 125.9 | | 20 day SMA | 126.18 | 125.96 | 125.82 | | 35 day SMA | 128.11 | 128.16 | 128.3 | | 50 day SMA | 128.71 | 128.77 | 128.91 | | 100 day SMA | 130.6 | 130.63 | 130.69 | | 150 day SMA | 128.22 | 128.25 | 128.31 | | 200 day SMA | 132.14 | 132.34 | 132.55 |
|
|
