TtkHealthcare TTKHLTCARE full analysis,charts,indicators,moving averages,SMA,DMA,EMA,ADX,MACD,RSITtk Healthcare TTKHLTCARE WideScreen charts, DMA,SMA,EMA technical analysis, forecast prediction, by indicators ADX,MACD,RSI,CCI NSE stock exchange
operates under Pharmaceuticals sector
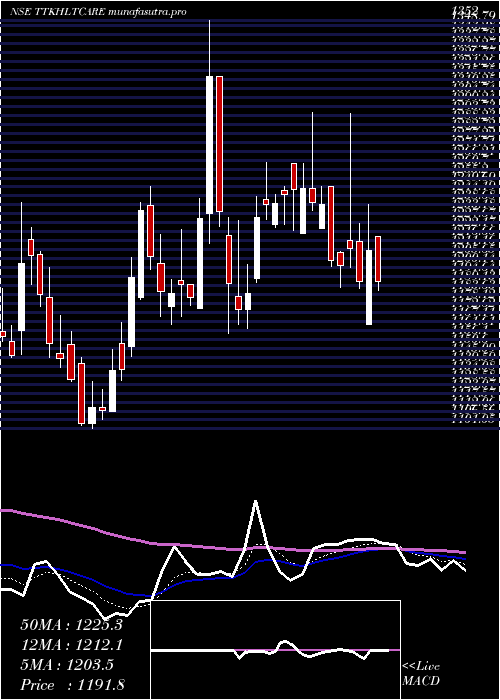
Daily price and charts and targets TtkHealthcare Strong Daily Stock price targets for TtkHealthcare TTKHLTCARE are 1160.45 and 1230.75 | Daily Target 1 | 1108.67 | | Daily Target 2 | 1141.93 | | Daily Target 3 | 1178.9666666667 | | Daily Target 4 | 1212.23 | | Daily Target 5 | 1249.27 |
Daily price and volume Ttk Healthcare
| Date |
Closing |
Open |
Range |
Volume |
Tue 28 October 2025 |
1175.20 (2.59%) |
1162.00 |
1145.70 - 1216.00 |
2.4167 times |
Mon 27 October 2025 |
1145.50 (-0.54%) |
1156.00 |
1139.00 - 1169.00 |
0.7671 times |
Fri 24 October 2025 |
1151.70 (-2.27%) |
1184.40 |
1144.10 - 1189.60 |
0.2829 times |
Thu 23 October 2025 |
1178.40 (-1.19%) |
1185.00 |
1160.00 - 1199.00 |
0.7981 times |
Tue 21 October 2025 |
1192.60 (1.59%) |
1198.00 |
1177.20 - 1201.00 |
0.5858 times |
Mon 20 October 2025 |
1173.90 (0.58%) |
1170.00 |
1160.00 - 1190.00 |
1.0441 times |
Fri 17 October 2025 |
1167.10 (3.21%) |
1131.80 |
1131.80 - 1182.40 |
2.9263 times |
Thu 16 October 2025 |
1130.80 (0.19%) |
1142.30 |
1125.00 - 1145.30 |
0.09 times |
Wed 15 October 2025 |
1128.60 (0.29%) |
1125.30 |
1125.30 - 1164.00 |
0.7797 times |
Tue 14 October 2025 |
1125.30 (-1.54%) |
1142.90 |
1125.00 - 1155.30 |
0.3094 times |
Mon 13 October 2025 |
1142.90 (-1.44%) |
1152.60 |
1136.10 - 1165.90 |
0.1763 times |
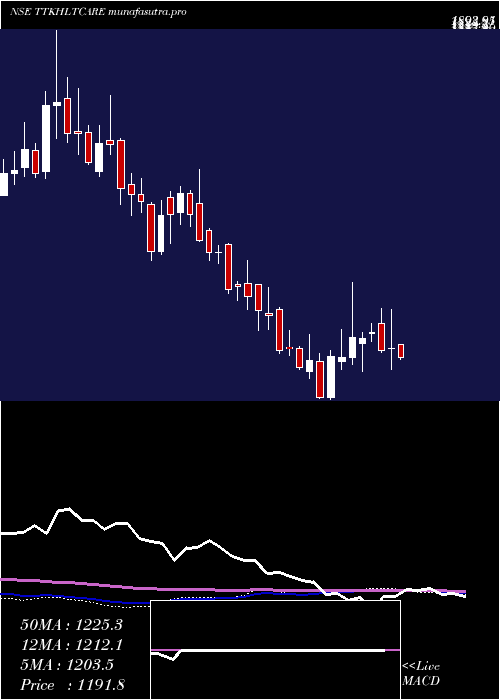
Weekly price and charts TtkHealthcare Strong weekly Stock price targets for TtkHealthcare TTKHLTCARE are 1157.1 and 1234.1 | Weekly Target 1 | 1099.73 | | Weekly Target 2 | 1137.47 | | Weekly Target 3 | 1176.7333333333 | | Weekly Target 4 | 1214.47 | | Weekly Target 5 | 1253.73 |
Weekly price and volumes for Ttk Healthcare
| Date |
Closing |
Open |
Range |
Volume |
Tue 28 October 2025 |
1175.20 (2.04%) |
1156.00 |
1139.00 - 1216.00 |
1.0939 times |
Fri 24 October 2025 |
1151.70 (-1.32%) |
1170.00 |
1144.10 - 1201.00 |
0.9314 times |
Fri 17 October 2025 |
1167.10 (0.65%) |
1152.60 |
1125.00 - 1182.40 |
1.4711 times |
Fri 10 October 2025 |
1159.60 (0.78%) |
1142.50 |
1135.10 - 1189.40 |
0.3946 times |
Fri 03 October 2025 |
1150.60 (-0.35%) |
1172.00 |
1130.50 - 1188.00 |
0.7425 times |
Fri 26 September 2025 |
1154.60 (-2.26%) |
1175.00 |
1152.00 - 1205.00 |
0.5773 times |
Fri 19 September 2025 |
1181.30 (-0.61%) |
1194.40 |
1171.00 - 1204.20 |
0.6312 times |
Fri 12 September 2025 |
1188.50 (3.22%) |
1155.20 |
1129.60 - 1202.90 |
0.774 times |
Fri 05 September 2025 |
1151.40 (-0.61%) |
1177.00 |
1124.20 - 1204.20 |
2.0062 times |
Fri 29 August 2025 |
1158.50 (1.02%) |
1164.50 |
1130.90 - 1216.80 |
1.3777 times |
Fri 22 August 2025 |
1146.80 (1.41%) |
1148.00 |
1129.50 - 1184.90 |
1.5972 times |
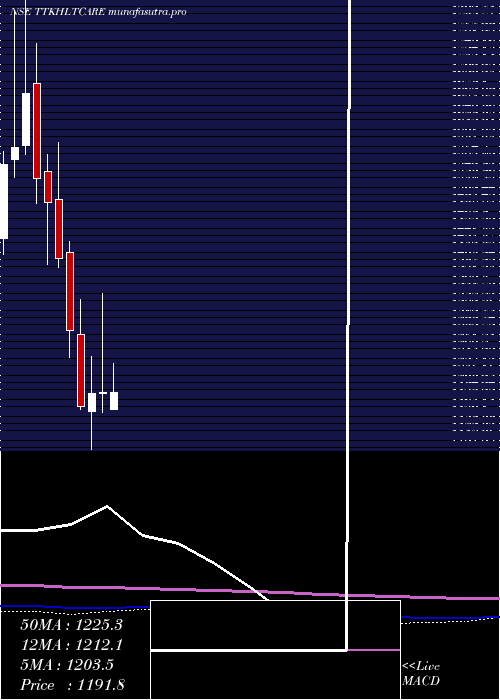
Monthly price and charts TtkHealthcare Strong monthly Stock price targets for TtkHealthcare TTKHLTCARE are 1150.1 and 1241.1 | Monthly Target 1 | 1081.07 | | Monthly Target 2 | 1128.13 | | Monthly Target 3 | 1172.0666666667 | | Monthly Target 4 | 1219.13 | | Monthly Target 5 | 1263.07 |
Monthly price and volumes Ttk Healthcare
| Date |
Closing |
Open |
Range |
Volume |
Tue 28 October 2025 |
1175.20 (1.98%) |
1164.90 |
1125.00 - 1216.00 |
0.4424 times |
Tue 30 September 2025 |
1152.40 (-0.53%) |
1177.00 |
1124.20 - 1205.00 |
0.4311 times |
Fri 29 August 2025 |
1158.50 (-6.89%) |
1258.00 |
1103.30 - 1272.00 |
0.7288 times |
Thu 31 July 2025 |
1244.20 (-2.61%) |
1290.00 |
1237.50 - 1398.90 |
0.9935 times |
Mon 30 June 2025 |
1277.60 (5.15%) |
1202.50 |
1196.10 - 1364.90 |
1.076 times |
Fri 30 May 2025 |
1215.00 (1.98%) |
1165.00 |
1125.00 - 1324.70 |
0.8748 times |
Wed 30 April 2025 |
1191.40 (0.11%) |
1190.05 |
1159.95 - 1352.00 |
0.7602 times |
Fri 28 March 2025 |
1190.05 (1.72%) |
1161.05 |
1101.05 - 1250.00 |
2.79 times |
Fri 28 February 2025 |
1169.95 (-9.42%) |
1285.00 |
1165.05 - 1342.10 |
1.0784 times |
Fri 31 January 2025 |
1291.60 (-8.24%) |
1418.45 |
1249.05 - 1436.00 |
0.825 times |
Tue 31 December 2024 |
1407.55 (-6.1%) |
1503.40 |
1393.05 - 1594.95 |
0.4671 times |
DMA SMA EMA moving averages of Ttk Healthcare TTKHLTCARE
DMA (daily moving average) of Ttk Healthcare TTKHLTCARE
| DMA period | DMA value | | 5 day DMA | 1168.68 | | 12 day DMA | 1155.97 | | 20 day DMA | 1155.05 | | 35 day DMA | 1162.48 | | 50 day DMA | 1159.04 | | 100 day DMA | 1216.04 | | 150 day DMA | 1216.4 | | 200 day DMA | 1224.26 | EMA (exponential moving average) of Ttk Healthcare TTKHLTCARE
| EMA period | EMA current | EMA prev | EMA prev2 | | 5 day EMA | 1163.99 | 1158.39 | 1164.84 | | 12 day EMA | 1160.81 | 1158.2 | 1160.51 | | 20 day EMA | 1159.76 | 1158.13 | 1159.46 | | 35 day EMA | 1157.42 | 1156.37 | 1157.01 | | 50 day EMA | 1158.29 | 1157.6 | 1158.09 |
SMA (simple moving average) of Ttk Healthcare TTKHLTCARE
| SMA period | SMA current | SMA prev | SMA prev2 | | 5 day SMA | 1168.68 | 1168.42 | 1172.74 | | 12 day SMA | 1155.97 | 1153.82 | 1155.56 | | 20 day SMA | 1155.05 | 1154.02 | 1155.29 | | 35 day SMA | 1162.48 | 1161.8 | 1161.55 | | 50 day SMA | 1159.04 | 1158.4 | 1158.33 | | 100 day SMA | 1216.04 | 1216.49 | 1217.27 | | 150 day SMA | 1216.4 | 1216.15 | 1215.92 | | 200 day SMA | 1224.26 | 1225.3 | 1226.66 |
|
|
