TrualtBioenergy TRUALT full analysis,charts,indicators,moving averages,SMA,DMA,EMA,ADX,MACD,RSITrualt Bioenergy TRUALT WideScreen charts, DMA,SMA,EMA technical analysis, forecast prediction, by indicators ADX,MACD,RSI,CCI NSE stock exchange
Daily price and charts and targets TrualtBioenergy Strong Daily Stock price targets for TrualtBioenergy TRUALT are 442.63 and 466.38 | Daily Target 1 | 425.67 | | Daily Target 2 | 435.83 | | Daily Target 3 | 449.41666666667 | | Daily Target 4 | 459.58 | | Daily Target 5 | 473.17 |
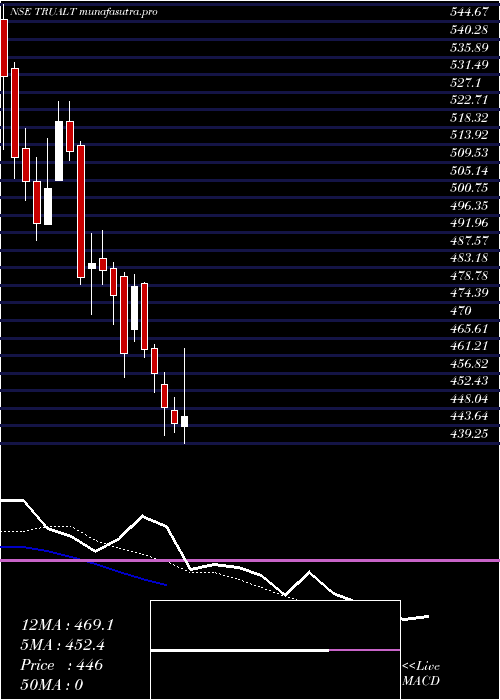
Daily price and volume Trualt Bioenergy
| Date |
Closing |
Open |
Range |
Volume |
Wed 29 October 2025 |
446.00 (0.38%) |
443.50 |
439.25 - 463.00 |
0.9737 times |
Tue 28 October 2025 |
444.30 (-0.86%) |
447.45 |
442.00 - 450.70 |
0.4164 times |
Mon 27 October 2025 |
448.15 (-1.89%) |
454.10 |
441.10 - 456.85 |
0.7837 times |
Fri 24 October 2025 |
456.80 (-1.3%) |
463.10 |
452.00 - 463.95 |
0.6664 times |
Thu 23 October 2025 |
462.80 (-3.26%) |
479.35 |
460.65 - 479.45 |
0.6774 times |
Tue 21 October 2025 |
478.40 (3.61%) |
467.65 |
464.85 - 481.50 |
0.4909 times |
Mon 20 October 2025 |
461.75 (-3.01%) |
481.05 |
455.75 - 482.00 |
1.6233 times |
Fri 17 October 2025 |
476.10 (-1.33%) |
482.90 |
469.00 - 484.60 |
1.2807 times |
Thu 16 October 2025 |
482.50 (-0.36%) |
485.50 |
479.05 - 492.40 |
1.6665 times |
Wed 15 October 2025 |
484.25 (0.73%) |
482.95 |
471.40 - 491.80 |
1.4209 times |
Tue 14 October 2025 |
480.75 (-6.17%) |
513.75 |
479.10 - 514.70 |
3.0279 times |
Weekly price and charts TrualtBioenergy Strong weekly Stock price targets for TrualtBioenergy TRUALT are 430.75 and 454.5 | Weekly Target 1 | 425.67 | | Weekly Target 2 | 435.83 | | Weekly Target 3 | 449.41666666667 | | Weekly Target 4 | 459.58 | | Weekly Target 5 | 473.17 |
Weekly price and volumes for Trualt Bioenergy
| Date |
Closing |
Open |
Range |
Volume |
Wed 29 October 2025 |
446.00 (-2.36%) |
454.10 |
439.25 - 463.00 |
0.2616 times |
Fri 24 October 2025 |
456.80 (-4.05%) |
481.05 |
452.00 - 482.00 |
0.4161 times |
Fri 17 October 2025 |
476.10 (-8.39%) |
519.70 |
469.00 - 524.90 |
1.0786 times |
Fri 10 October 2025 |
519.70 (0%) |
533.00 |
490.00 - 534.50 |
2.2437 times |
Wed 29 October 2025 |
(0%) |
|
- |
0 times |

Monthly price and charts TrualtBioenergy Strong monthly Stock price targets for TrualtBioenergy TRUALT are 387.75 and 497.5 | Monthly Target 1 | 368.33 | | Monthly Target 2 | 407.17 | | Monthly Target 3 | 478.08333333333 | | Monthly Target 4 | 516.92 | | Monthly Target 5 | 587.83 |
Monthly price and volumes Trualt Bioenergy
| Date |
Closing |
Open |
Range |
Volume |
Wed 29 October 2025 |
446.00 (0%) |
545.40 |
439.25 - 549.00 |
1 times |
Wed 29 October 2025 |
(0%) |
|
- |
0 times |

DMA SMA EMA moving averages of Trualt Bioenergy TRUALT
DMA (daily moving average) of Trualt Bioenergy TRUALT
| DMA period | DMA value | | 5 day DMA | 451.61 | | 12 day DMA | 469.51 | | 20 day DMA | | | 35 day DMA | | | 50 day DMA | | | 100 day DMA | | | 150 day DMA | | | 200 day DMA | | EMA (exponential moving average) of Trualt Bioenergy TRUALT
| EMA period | EMA current | EMA prev | EMA prev2 | | 5 day EMA | 452.36 | 455.54 | 461.16 | | 12 day EMA | 469.14 | 473.35 | 478.63 | | 20 day EMA | 0 | 0 | 0 | | 35 day EMA | 0 | 0 | 0 | | 50 day EMA | 0 | 0 | 0 |
SMA (simple moving average) of Trualt Bioenergy TRUALT
| SMA period | SMA current | SMA prev | SMA prev2 | | 5 day SMA | 451.61 | 458.09 | 461.58 | | 12 day SMA | 469.51 | 475.65 | 480.55 | | 20 day SMA | | 35 day SMA | | 50 day SMA | | 100 day SMA | | 150 day SMA | | 200 day SMA |
|
|
