TriveniTurbine TRITURBINE full analysis,charts,indicators,moving averages,SMA,DMA,EMA,ADX,MACD,RSITriveni Turbine TRITURBINE WideScreen charts, DMA,SMA,EMA technical analysis, forecast prediction, by indicators ADX,MACD,RSI,CCI NSE stock exchange
operates under Heavy Electrical Equipment sector
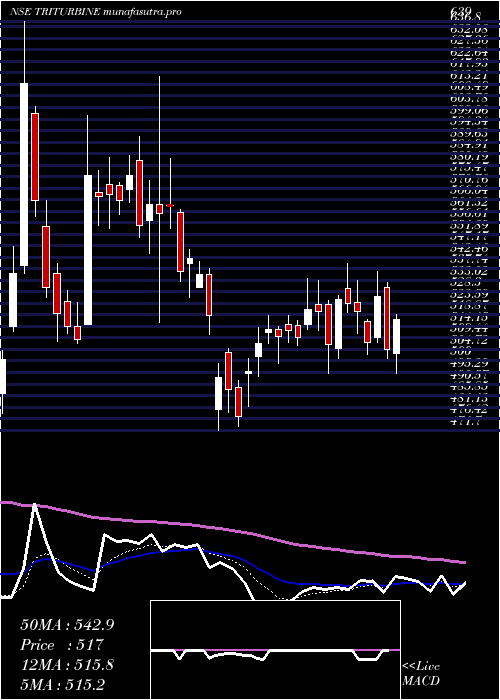
Daily price and charts and targets TriveniTurbine Strong Daily Stock price targets for TriveniTurbine TRITURBINE are 520.5 and 526.8 | Daily Target 1 | 515.7 | | Daily Target 2 | 519 | | Daily Target 3 | 522 | | Daily Target 4 | 525.3 | | Daily Target 5 | 528.3 |
Daily price and volume Triveni Turbine
| Date |
Closing |
Open |
Range |
Volume |
Tue 28 October 2025 |
522.30 (0.25%) |
521.00 |
518.70 - 525.00 |
0.9628 times |
Mon 27 October 2025 |
521.00 (-0.56%) |
524.00 |
517.70 - 525.75 |
0.9756 times |
Fri 24 October 2025 |
523.95 (-0.91%) |
529.00 |
522.30 - 532.40 |
0.5172 times |
Thu 23 October 2025 |
528.75 (0.1%) |
530.00 |
523.00 - 532.00 |
0.9172 times |
Tue 21 October 2025 |
528.20 (1.95%) |
522.00 |
520.00 - 534.50 |
0.6363 times |
Mon 20 October 2025 |
518.10 (-0.61%) |
522.05 |
515.55 - 523.00 |
1.1393 times |
Fri 17 October 2025 |
521.30 (-0.19%) |
522.00 |
518.00 - 525.45 |
1.5017 times |
Thu 16 October 2025 |
522.30 (-0.23%) |
525.50 |
518.60 - 525.80 |
1.2134 times |
Wed 15 October 2025 |
523.50 (-0.12%) |
523.00 |
516.80 - 526.00 |
1.3015 times |
Tue 14 October 2025 |
524.15 (-0.25%) |
525.60 |
520.80 - 527.80 |
0.8352 times |
Mon 13 October 2025 |
525.45 (-0.23%) |
520.05 |
520.05 - 528.10 |
0.8287 times |
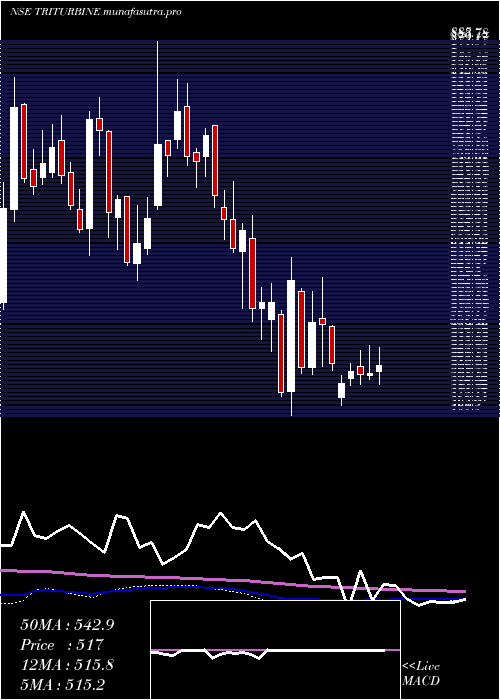
Weekly price and charts TriveniTurbine Strong weekly Stock price targets for TriveniTurbine TRITURBINE are 515.98 and 524.03 | Weekly Target 1 | 513.87 | | Weekly Target 2 | 518.08 | | Weekly Target 3 | 521.91666666667 | | Weekly Target 4 | 526.13 | | Weekly Target 5 | 529.97 |
Weekly price and volumes for Triveni Turbine
| Date |
Closing |
Open |
Range |
Volume |
Tue 28 October 2025 |
522.30 (-0.31%) |
524.00 |
517.70 - 525.75 |
0.2093 times |
Fri 24 October 2025 |
523.95 (0.51%) |
522.05 |
515.55 - 534.50 |
0.3466 times |
Fri 17 October 2025 |
521.30 (-1.02%) |
520.05 |
516.80 - 528.10 |
0.6134 times |
Fri 10 October 2025 |
526.65 (0.96%) |
521.15 |
518.10 - 538.50 |
1.2925 times |
Fri 03 October 2025 |
521.65 (1.19%) |
515.65 |
511.95 - 528.45 |
0.4119 times |
Fri 26 September 2025 |
515.50 (-3.84%) |
538.00 |
508.55 - 547.00 |
1.2033 times |
Fri 19 September 2025 |
536.10 (0.84%) |
536.80 |
531.30 - 554.00 |
1.5894 times |
Fri 12 September 2025 |
531.65 (4.03%) |
515.00 |
506.00 - 538.70 |
1.2083 times |
Fri 05 September 2025 |
511.05 (-1.55%) |
519.80 |
507.00 - 533.35 |
1.882 times |
Fri 29 August 2025 |
519.10 (-2.8%) |
534.05 |
515.55 - 538.80 |
1.2432 times |
Fri 22 August 2025 |
534.05 (4.45%) |
514.05 |
507.00 - 539.30 |
1.4763 times |
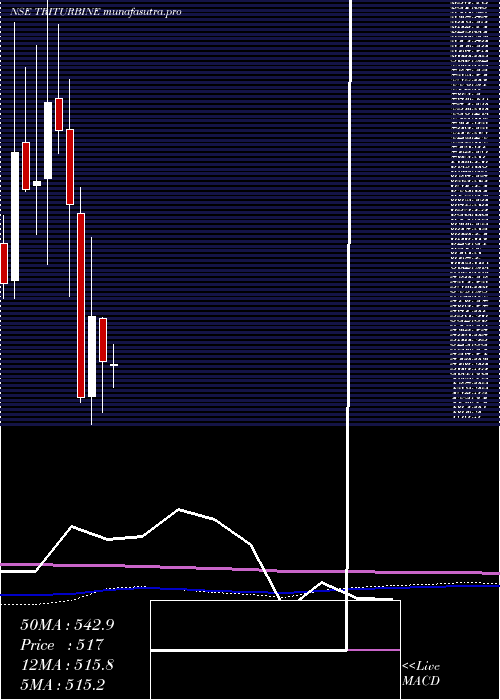
Monthly price and charts TriveniTurbine Strong monthly Stock price targets for TriveniTurbine TRITURBINE are 518.93 and 541.88 | Monthly Target 1 | 502.5 | | Monthly Target 2 | 512.4 | | Monthly Target 3 | 525.45 | | Monthly Target 4 | 535.35 | | Monthly Target 5 | 548.4 |
Monthly price and volumes Triveni Turbine
| Date |
Closing |
Open |
Range |
Volume |
Tue 28 October 2025 |
522.30 (0.65%) |
518.95 |
515.55 - 538.50 |
0.1843 times |
Tue 30 September 2025 |
518.95 (-0.03%) |
519.80 |
506.00 - 554.00 |
0.4235 times |
Fri 29 August 2025 |
519.10 (-13.38%) |
598.95 |
507.00 - 606.00 |
0.6412 times |
Thu 31 July 2025 |
599.30 (-2.15%) |
614.80 |
593.10 - 675.20 |
0.7449 times |
Mon 30 June 2025 |
612.45 (5.37%) |
582.00 |
572.85 - 639.00 |
0.9229 times |
Fri 30 May 2025 |
581.25 (11.75%) |
516.00 |
495.05 - 622.90 |
1.5038 times |
Wed 30 April 2025 |
520.15 (-7.71%) |
560.95 |
471.70 - 562.00 |
0.9016 times |
Fri 28 March 2025 |
563.60 (15.97%) |
486.75 |
460.30 - 639.00 |
2.8801 times |
Fri 28 February 2025 |
486.00 (-27.5%) |
661.50 |
481.00 - 686.95 |
1.3196 times |
Fri 31 January 2025 |
670.35 (-9.58%) |
742.00 |
582.00 - 789.90 |
0.478 times |
Tue 31 December 2024 |
741.35 (-3.43%) |
771.95 |
719.25 - 842.00 |
1.0086 times |
DMA SMA EMA moving averages of Triveni Turbine TRITURBINE
DMA (daily moving average) of Triveni Turbine TRITURBINE
| DMA period | DMA value | | 5 day DMA | 524.84 | | 12 day DMA | 523.8 | | 20 day DMA | 523.45 | | 35 day DMA | 524.87 | | 50 day DMA | 524.89 | | 100 day DMA | 565.96 | | 150 day DMA | 559.63 | | 200 day DMA | 570.08 | EMA (exponential moving average) of Triveni Turbine TRITURBINE
| EMA period | EMA current | EMA prev | EMA prev2 | | 5 day EMA | 523.16 | 523.59 | 524.88 | | 12 day EMA | 523.65 | 523.89 | 524.42 | | 20 day EMA | 523.97 | 524.15 | 524.48 | | 35 day EMA | 524.06 | 524.16 | 524.35 | | 50 day EMA | 524.47 | 524.56 | 524.71 |
SMA (simple moving average) of Triveni Turbine TRITURBINE
| SMA period | SMA current | SMA prev | SMA prev2 | | 5 day SMA | 524.84 | 524 | 524.06 | | 12 day SMA | 523.8 | 524.28 | 524.73 | | 20 day SMA | 523.45 | 523.11 | 522.87 | | 35 day SMA | 524.87 | 524.55 | 524.37 | | 50 day SMA | 524.89 | 524.78 | 524.67 | | 100 day SMA | 565.96 | 566.65 | 567.34 | | 150 day SMA | 559.63 | 559.93 | 560.3 | | 200 day SMA | 570.08 | 571.23 | 572.51 |
|
|
