Trident TRIDENT full analysis,charts,indicators,moving averages,SMA,DMA,EMA,ADX,MACD,RSITrident TRIDENT WideScreen charts, DMA,SMA,EMA technical analysis, forecast prediction, by indicators ADX,MACD,RSI,CCI NSE stock exchange
operates under Textiles sector
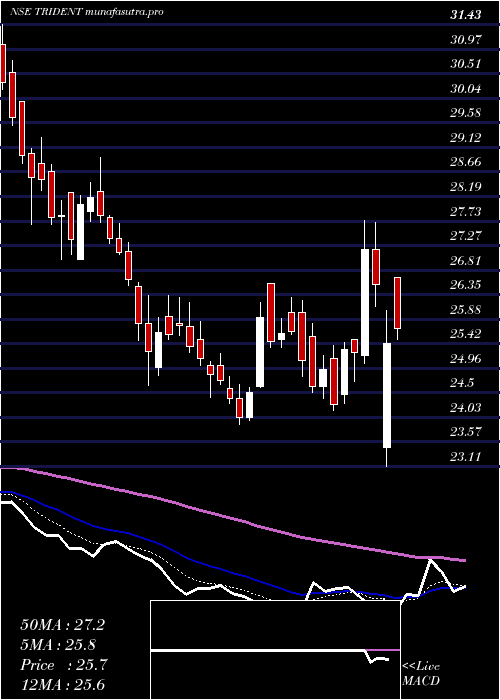
Daily price and charts and targets Trident Strong Daily Stock price targets for Trident TRIDENT are 28.72 and 29.46 | Daily Target 1 | 28.14 | | Daily Target 2 | 28.56 | | Daily Target 3 | 28.883333333333 | | Daily Target 4 | 29.3 | | Daily Target 5 | 29.62 |
Daily price and volume Trident
| Date |
Closing |
Open |
Range |
Volume |
Wed 29 October 2025 |
28.97 (1.61%) |
28.52 |
28.47 - 29.21 |
1.322 times |
Tue 28 October 2025 |
28.51 (-0.38%) |
28.75 |
28.40 - 28.75 |
0.536 times |
Mon 27 October 2025 |
28.62 (0.1%) |
28.64 |
28.55 - 28.72 |
0.5564 times |
Fri 24 October 2025 |
28.59 (-0.42%) |
28.72 |
28.40 - 29.00 |
0.7933 times |
Thu 23 October 2025 |
28.71 (1.81%) |
28.81 |
28.53 - 30.00 |
3.9273 times |
Tue 21 October 2025 |
28.20 (1.04%) |
28.00 |
27.91 - 28.29 |
0.1897 times |
Mon 20 October 2025 |
27.91 (-0.04%) |
27.90 |
27.63 - 28.08 |
0.6202 times |
Fri 17 October 2025 |
27.92 (-0.5%) |
28.02 |
27.83 - 28.11 |
0.5282 times |
Thu 16 October 2025 |
28.06 (0.83%) |
27.90 |
27.88 - 28.45 |
0.752 times |
Wed 15 October 2025 |
27.83 (-0.07%) |
27.85 |
27.75 - 27.98 |
0.7747 times |
Tue 14 October 2025 |
27.85 (-1.14%) |
28.17 |
27.80 - 28.30 |
0.5222 times |
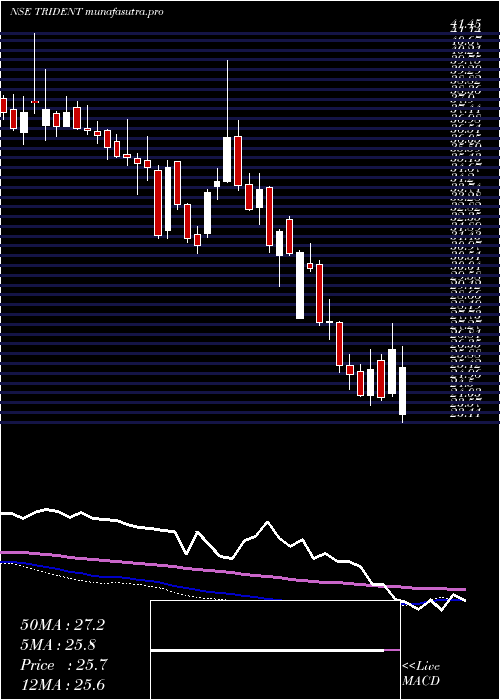
Weekly price and charts Trident Strong weekly Stock price targets for Trident TRIDENT are 28.69 and 29.5 | Weekly Target 1 | 28.05 | | Weekly Target 2 | 28.51 | | Weekly Target 3 | 28.86 | | Weekly Target 4 | 29.32 | | Weekly Target 5 | 29.67 |
Weekly price and volumes for Trident
| Date |
Closing |
Open |
Range |
Volume |
Wed 29 October 2025 |
28.97 (1.33%) |
28.64 |
28.40 - 29.21 |
0.5336 times |
Fri 24 October 2025 |
28.59 (2.4%) |
27.90 |
27.63 - 30.00 |
1.2222 times |
Fri 17 October 2025 |
27.92 (-1.52%) |
28.33 |
27.75 - 28.45 |
0.6712 times |
Fri 10 October 2025 |
28.35 (-0.91%) |
28.70 |
28.02 - 28.88 |
0.6895 times |
Fri 03 October 2025 |
28.61 (-0.28%) |
28.69 |
28.00 - 28.76 |
0.5186 times |
Fri 26 September 2025 |
28.69 (-4.75%) |
30.19 |
28.40 - 30.65 |
1.1029 times |
Fri 19 September 2025 |
30.12 (4.11%) |
29.00 |
28.82 - 30.36 |
1.6606 times |
Fri 12 September 2025 |
28.93 (2.44%) |
28.32 |
28.02 - 30.00 |
1.887 times |
Fri 05 September 2025 |
28.24 (3.18%) |
27.30 |
27.27 - 29.11 |
1.0268 times |
Fri 29 August 2025 |
27.37 (-3.93%) |
28.25 |
27.14 - 28.73 |
0.6877 times |
Fri 22 August 2025 |
28.49 (1.86%) |
28.28 |
28.01 - 29.14 |
1.0252 times |
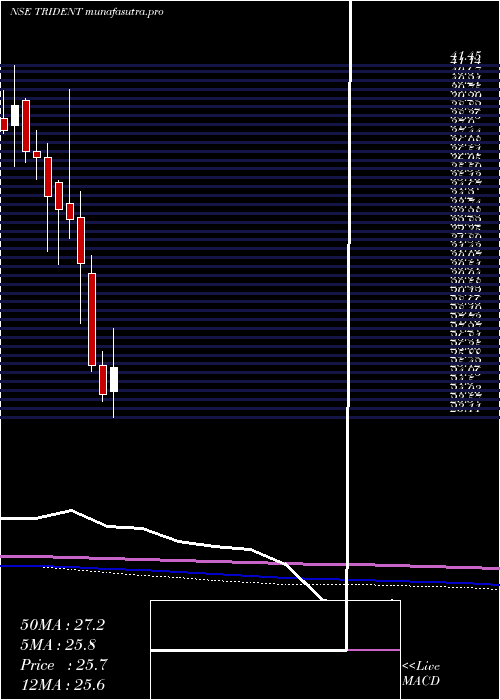
Monthly price and charts Trident Strong monthly Stock price targets for Trident TRIDENT are 28.3 and 30.67 | Monthly Target 1 | 26.5 | | Monthly Target 2 | 27.73 | | Monthly Target 3 | 28.866666666667 | | Monthly Target 4 | 30.1 | | Monthly Target 5 | 31.24 |
Monthly price and volumes Trident
| Date |
Closing |
Open |
Range |
Volume |
Wed 29 October 2025 |
28.97 (2.84%) |
28.15 |
27.63 - 30.00 |
0.3907 times |
Tue 30 September 2025 |
28.17 (2.92%) |
27.30 |
27.27 - 30.65 |
0.6886 times |
Fri 29 August 2025 |
27.37 (-8.74%) |
30.05 |
27.14 - 30.09 |
0.4916 times |
Thu 31 July 2025 |
29.99 (-4.25%) |
31.50 |
29.28 - 33.66 |
1.9265 times |
Mon 30 June 2025 |
31.32 (-1.48%) |
31.79 |
28.91 - 33.24 |
1.4418 times |
Fri 30 May 2025 |
31.79 (19.96%) |
26.76 |
26.25 - 34.62 |
1.4302 times |
Wed 30 April 2025 |
26.50 (9.19%) |
24.47 |
23.11 - 29.74 |
1.7402 times |
Fri 28 March 2025 |
24.27 (-5.89%) |
25.80 |
23.90 - 26.55 |
0.801 times |
Fri 28 February 2025 |
25.79 (-17.07%) |
30.60 |
25.47 - 31.54 |
0.4129 times |
Fri 31 January 2025 |
31.10 (-7%) |
33.53 |
28.00 - 34.87 |
0.6766 times |
Tue 31 December 2024 |
33.44 (-1.5%) |
34.23 |
32.45 - 40.20 |
2.7909 times |
DMA SMA EMA moving averages of Trident TRIDENT
DMA (daily moving average) of Trident TRIDENT
| DMA period | DMA value | | 5 day DMA | 28.68 | | 12 day DMA | 28.28 | | 20 day DMA | 28.3 | | 35 day DMA | 28.73 | | 50 day DMA | 28.57 | | 100 day DMA | 29.51 | | 150 day DMA | 29.1 | | 200 day DMA | 28.98 | EMA (exponential moving average) of Trident TRIDENT
| EMA period | EMA current | EMA prev | EMA prev2 | | 5 day EMA | 28.64 | 28.48 | 28.46 | | 12 day EMA | 28.46 | 28.37 | 28.35 | | 20 day EMA | 28.46 | 28.41 | 28.4 | | 35 day EMA | 28.41 | 28.38 | 28.37 | | 50 day EMA | 28.52 | 28.5 | 28.5 |
SMA (simple moving average) of Trident TRIDENT
| SMA period | SMA current | SMA prev | SMA prev2 | | 5 day SMA | 28.68 | 28.53 | 28.41 | | 12 day SMA | 28.28 | 28.23 | 28.2 | | 20 day SMA | 28.3 | 28.26 | 28.27 | | 35 day SMA | 28.73 | 28.71 | 28.7 | | 50 day SMA | 28.57 | 28.55 | 28.54 | | 100 day SMA | 29.51 | 29.53 | 29.55 | | 150 day SMA | 29.1 | 29.07 | 29.06 | | 200 day SMA | 28.98 | 29 | 29.02 |
|
|
