TranswindInfra TRANSWIND_SM full analysis,charts,indicators,moving averages,SMA,DMA,EMA,ADX,MACD,RSITranswind Infra TRANSWIND_SM WideScreen charts, DMA,SMA,EMA technical analysis, forecast prediction, by indicators ADX,MACD,RSI,CCI NSE stock exchange
Daily price and charts and targets TranswindInfra Strong Daily Stock price targets for TranswindInfra TRANSWIND_SM are 15.85 and 15.85 | Daily Target 1 | 15.85 | | Daily Target 2 | 15.85 | | Daily Target 3 | 15.85 | | Daily Target 4 | 15.85 | | Daily Target 5 | 15.85 |
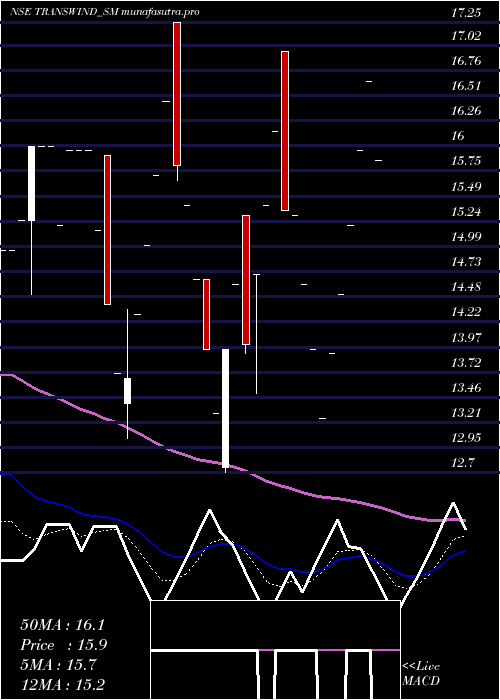
Daily price and volume Transwind Infra
| Date |
Closing |
Open |
Range |
Volume |
Wed 29 October 2025 |
15.85 (-4.8%) |
15.85 |
15.85 - 15.85 |
1 times |
Tue 28 October 2025 |
16.65 (4.39%) |
16.65 |
16.65 - 16.65 |
1 times |
Mon 27 October 2025 |
15.95 (4.93%) |
15.95 |
15.95 - 15.95 |
1 times |
Fri 24 October 2025 |
15.20 (4.83%) |
15.20 |
15.20 - 15.20 |
1 times |
Mon 20 October 2025 |
14.50 (4.32%) |
14.50 |
14.50 - 14.50 |
1 times |
Fri 17 October 2025 |
13.90 (4.91%) |
13.90 |
13.90 - 13.90 |
1 times |
Wed 15 October 2025 |
13.25 (-5.02%) |
13.25 |
13.25 - 13.25 |
1 times |
Tue 14 October 2025 |
13.95 (-4.45%) |
13.95 |
13.95 - 13.95 |
1 times |
Wed 08 October 2025 |
14.60 (-4.58%) |
14.60 |
14.60 - 14.60 |
1 times |
Tue 07 October 2025 |
15.30 (-0.33%) |
15.30 |
15.30 - 15.30 |
1 times |
Mon 06 October 2025 |
15.35 (-4.95%) |
16.95 |
15.35 - 16.95 |
4 times |
Weekly price and charts TranswindInfra Strong weekly Stock price targets for TranswindInfra TRANSWIND_SM are 15.45 and 16.25 | Weekly Target 1 | 15.32 | | Weekly Target 2 | 15.58 | | Weekly Target 3 | 16.116666666667 | | Weekly Target 4 | 16.38 | | Weekly Target 5 | 16.92 |
Weekly price and volumes for Transwind Infra
| Date |
Closing |
Open |
Range |
Volume |
Wed 29 October 2025 |
15.85 (4.28%) |
15.95 |
15.85 - 16.65 |
0.5263 times |
Fri 24 October 2025 |
15.20 (9.35%) |
14.50 |
14.50 - 15.20 |
0.3509 times |
Fri 17 October 2025 |
13.90 (-4.79%) |
13.95 |
13.25 - 13.95 |
0.5263 times |
Wed 08 October 2025 |
14.60 (-9.6%) |
16.95 |
14.60 - 16.95 |
1.0526 times |
Wed 01 October 2025 |
16.15 (15.36%) |
14.70 |
13.50 - 16.15 |
0.8772 times |
Thu 25 September 2025 |
14.00 (5.26%) |
12.75 |
12.70 - 15.30 |
1.9298 times |
Thu 18 September 2025 |
13.30 (-9.22%) |
14.65 |
13.30 - 14.65 |
0.7018 times |
Fri 12 September 2025 |
14.65 (-10.94%) |
17.25 |
14.65 - 17.25 |
2.2807 times |
Thu 04 September 2025 |
16.45 (9.67%) |
15.70 |
15.70 - 16.45 |
1.2281 times |
Fri 29 August 2025 |
15.00 (9.89%) |
14.30 |
14.30 - 15.00 |
0.5263 times |
Thu 21 August 2025 |
13.65 (-9.9%) |
15.90 |
13.05 - 15.90 |
1.4035 times |

Monthly price and charts TranswindInfra Strong monthly Stock price targets for TranswindInfra TRANSWIND_SM are 12.7 and 16.4 | Monthly Target 1 | 11.65 | | Monthly Target 2 | 13.75 | | Monthly Target 3 | 15.35 | | Monthly Target 4 | 17.45 | | Monthly Target 5 | 19.05 |
Monthly price and volumes Transwind Infra
| Date |
Closing |
Open |
Range |
Volume |
Wed 29 October 2025 |
15.85 (2.92%) |
16.15 |
13.25 - 16.95 |
1.4151 times |
Tue 30 September 2025 |
15.40 (2.67%) |
15.70 |
12.70 - 17.25 |
3.6792 times |
Fri 29 August 2025 |
15.00 (-0.99%) |
15.90 |
13.05 - 15.90 |
1.0377 times |
Wed 23 July 2025 |
15.15 (-5.02%) |
15.95 |
15.15 - 15.95 |
0.4717 times |
Mon 30 June 2025 |
15.95 (6.69%) |
15.25 |
14.50 - 16.00 |
0.9434 times |
Fri 30 May 2025 |
14.95 (-12.83%) |
17.15 |
14.95 - 17.15 |
0.6604 times |
Wed 30 April 2025 |
17.15 (-7.3%) |
18.55 |
17.15 - 18.55 |
1.0377 times |
Fri 28 March 2025 |
18.50 (-8.87%) |
19.55 |
18.50 - 21.05 |
0.566 times |
Mon 10 February 2025 |
20.30 (-4.92%) |
20.30 |
20.30 - 20.30 |
0.0943 times |
Wed 22 January 2025 |
21.35 (-24.82%) |
21.35 |
21.35 - 21.35 |
0.0943 times |
Tue 08 October 2024 |
28.40 (-6.43%) |
28.40 |
28.40 - 28.40 |
0.1887 times |

DMA SMA EMA moving averages of Transwind Infra TRANSWIND_SM
DMA (daily moving average) of Transwind Infra TRANSWIND_SM
| DMA period | DMA value | | 5 day DMA | 15.63 | | 12 day DMA | 15.05 | | 20 day DMA | 14.76 | | 35 day DMA | 14.97 | | 50 day DMA | 15.48 | | 100 day DMA | 18.91 | | 150 day DMA | 19.49 | | 200 day DMA | 17.34 | EMA (exponential moving average) of Transwind Infra TRANSWIND_SM
| EMA period | EMA current | EMA prev | EMA prev2 | | 5 day EMA | 15.66 | 15.56 | 15.02 | | 12 day EMA | 15.2 | 15.08 | 14.79 | | 20 day EMA | 15.12 | 15.04 | 14.87 | | 35 day EMA | 15.4 | 15.37 | 15.29 | | 50 day EMA | 15.79 | 15.79 | 15.76 |
SMA (simple moving average) of Transwind Infra TRANSWIND_SM
| SMA period | SMA current | SMA prev | SMA prev2 | | 5 day SMA | 15.63 | 15.24 | 14.56 | | 12 day SMA | 15.05 | 15.02 | 14.85 | | 20 day SMA | 14.76 | 14.74 | 14.7 | | 35 day SMA | 14.97 | 14.97 | 14.95 | | 50 day SMA | 15.48 | 15.52 | 15.56 | | 100 day SMA | 18.91 | 18.99 | 19.07 | | 150 day SMA | 19.49 | 19.47 | 19.44 | | 200 day SMA | 17.34 | 17.31 | 17.28 |
|
|
