TracxnTechnologies TRACXN full analysis,charts,indicators,moving averages,SMA,DMA,EMA,ADX,MACD,RSITracxn Technologies TRACXN WideScreen charts, DMA,SMA,EMA technical analysis, forecast prediction, by indicators ADX,MACD,RSI,CCI NSE stock exchange
Daily price and charts and targets TracxnTechnologies Strong Daily Stock price targets for TracxnTechnologies TRACXN are 51.65 and 52.65 | Daily Target 1 | 51.43 | | Daily Target 2 | 51.87 | | Daily Target 3 | 52.43 | | Daily Target 4 | 52.87 | | Daily Target 5 | 53.43 |
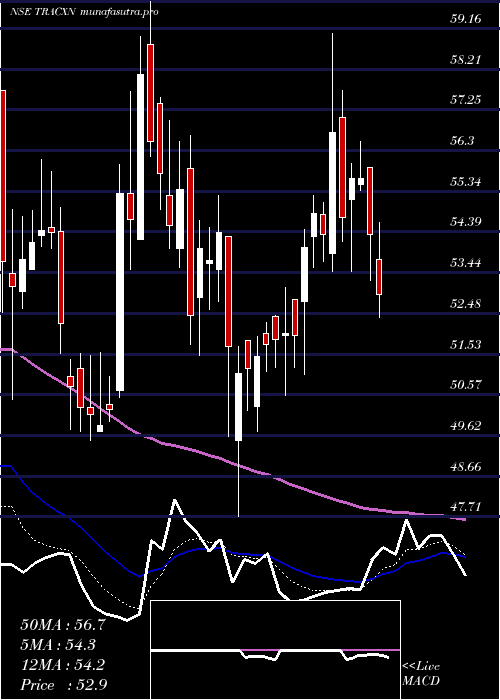
Daily price and volume Tracxn Technologies
| Date |
Closing |
Open |
Range |
Volume |
Tue 28 October 2025 |
52.31 (-0.3%) |
52.49 |
51.99 - 52.99 |
0.3585 times |
Mon 27 October 2025 |
52.47 (-0.04%) |
52.55 |
52.41 - 53.01 |
0.2564 times |
Fri 24 October 2025 |
52.49 (-1.11%) |
52.82 |
52.40 - 53.50 |
1.4257 times |
Thu 23 October 2025 |
53.08 (-1.65%) |
54.59 |
52.93 - 55.27 |
1.8654 times |
Tue 21 October 2025 |
53.97 (1.28%) |
52.80 |
52.80 - 54.47 |
0.1677 times |
Mon 20 October 2025 |
53.29 (-1.31%) |
54.90 |
53.00 - 54.90 |
0.5682 times |
Fri 17 October 2025 |
54.00 (-2.32%) |
55.90 |
53.31 - 55.90 |
1.2244 times |
Thu 16 October 2025 |
55.28 (4.84%) |
52.98 |
51.80 - 55.66 |
1.8861 times |
Wed 15 October 2025 |
52.73 (-0.19%) |
53.29 |
52.00 - 53.29 |
0.4174 times |
Tue 14 October 2025 |
52.83 (4.37%) |
51.00 |
50.55 - 54.50 |
1.8302 times |
Mon 13 October 2025 |
50.62 (-1.31%) |
51.30 |
50.21 - 51.39 |
0.3624 times |
Weekly price and charts TracxnTechnologies Strong weekly Stock price targets for TracxnTechnologies TRACXN are 51.64 and 52.66 | Weekly Target 1 | 51.42 | | Weekly Target 2 | 51.86 | | Weekly Target 3 | 52.436666666667 | | Weekly Target 4 | 52.88 | | Weekly Target 5 | 53.46 |
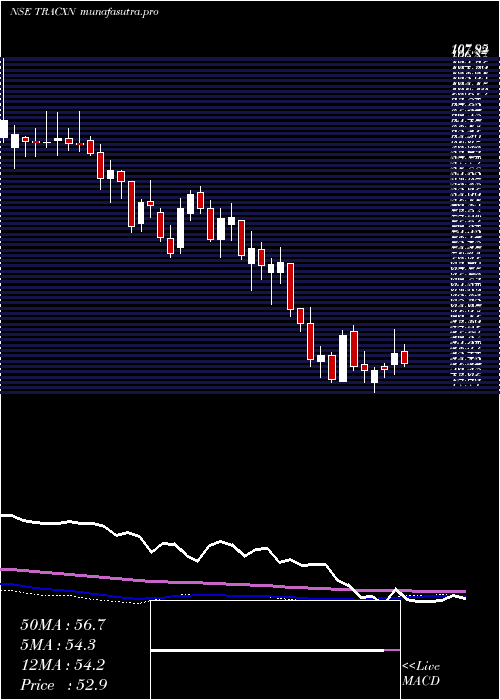
Weekly price and volumes for Tracxn Technologies
| Date |
Closing |
Open |
Range |
Volume |
Tue 28 October 2025 |
52.31 (-0.34%) |
52.55 |
51.99 - 53.01 |
0.1495 times |
Fri 24 October 2025 |
52.49 (-2.8%) |
54.90 |
52.40 - 55.27 |
0.9793 times |
Fri 17 October 2025 |
54.00 (5.28%) |
51.30 |
50.21 - 55.90 |
1.3911 times |
Fri 10 October 2025 |
51.29 (2.15%) |
50.80 |
49.27 - 52.00 |
0.6809 times |
Fri 03 October 2025 |
50.21 (0.3%) |
50.07 |
49.55 - 50.87 |
0.4546 times |
Fri 26 September 2025 |
50.06 (-2.04%) |
51.85 |
49.98 - 53.16 |
1.1721 times |
Fri 19 September 2025 |
51.10 (-0.23%) |
51.25 |
50.60 - 51.79 |
0.9311 times |
Fri 12 September 2025 |
51.22 (1.93%) |
50.05 |
50.05 - 51.99 |
1.059 times |
Fri 05 September 2025 |
50.25 (1.37%) |
49.90 |
49.56 - 54.30 |
1.8397 times |
Fri 29 August 2025 |
49.57 (-3.16%) |
51.69 |
47.32 - 53.00 |
1.3426 times |
Fri 22 August 2025 |
51.19 (0.37%) |
51.00 |
50.95 - 53.41 |
0.7302 times |
Monthly price and charts TracxnTechnologies Strong monthly Stock price targets for TracxnTechnologies TRACXN are 50.79 and 57.42 | Monthly Target 1 | 45.86 | | Monthly Target 2 | 49.09 | | Monthly Target 3 | 52.493333333333 | | Monthly Target 4 | 55.72 | | Monthly Target 5 | 59.12 |
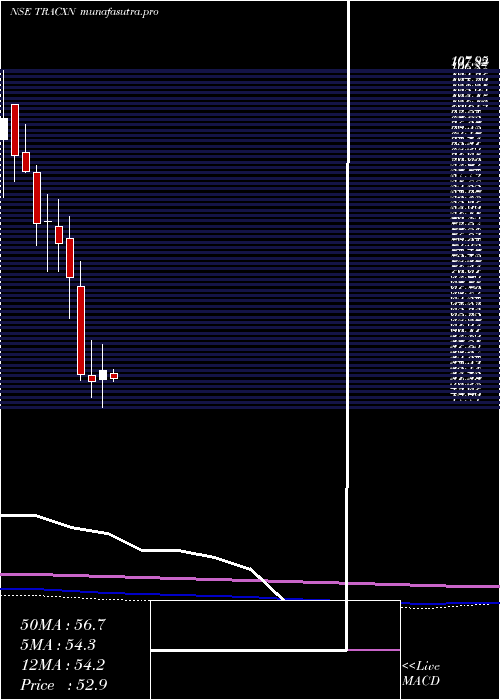
Monthly price and volumes Tracxn Technologies
| Date |
Closing |
Open |
Range |
Volume |
Tue 28 October 2025 |
52.31 (5%) |
49.99 |
49.27 - 55.90 |
0.6021 times |
Tue 30 September 2025 |
49.82 (0.5%) |
49.90 |
49.55 - 54.30 |
0.9359 times |
Fri 29 August 2025 |
49.57 (-11.61%) |
56.07 |
47.32 - 57.70 |
0.668 times |
Thu 31 July 2025 |
56.08 (-5.03%) |
59.33 |
52.90 - 63.89 |
1.3325 times |
Mon 30 June 2025 |
59.05 (2.79%) |
57.45 |
55.40 - 61.60 |
0.7922 times |
Fri 30 May 2025 |
57.45 (5.72%) |
53.75 |
50.75 - 65.80 |
1.0387 times |
Wed 30 April 2025 |
54.34 (3.62%) |
52.84 |
47.71 - 59.05 |
1.0191 times |
Fri 28 March 2025 |
52.44 (-2.33%) |
53.42 |
49.49 - 59.79 |
2.0116 times |
Fri 28 February 2025 |
53.69 (-24.34%) |
69.47 |
52.51 - 73.89 |
0.7264 times |
Fri 31 January 2025 |
70.96 (-7.92%) |
77.95 |
63.70 - 81.90 |
0.8735 times |
Tue 31 December 2024 |
77.06 (-4.88%) |
80.15 |
72.15 - 84.90 |
1.066 times |
DMA SMA EMA moving averages of Tracxn Technologies TRACXN
DMA (daily moving average) of Tracxn Technologies TRACXN
| DMA period | DMA value | | 5 day DMA | 52.86 | | 12 day DMA | 52.86 | | 20 day DMA | 51.85 | | 35 day DMA | 51.47 | | 50 day DMA | 51.32 | | 100 day DMA | 54.4 | | 150 day DMA | 54.82 | | 200 day DMA | 57.09 | EMA (exponential moving average) of Tracxn Technologies TRACXN
| EMA period | EMA current | EMA prev | EMA prev2 | | 5 day EMA | 52.69 | 52.88 | 53.09 | | 12 day EMA | 52.58 | 52.63 | 52.66 | | 20 day EMA | 52.25 | 52.24 | 52.22 | | 35 day EMA | 51.95 | 51.93 | 51.9 | | 50 day EMA | 51.67 | 51.64 | 51.61 |
SMA (simple moving average) of Tracxn Technologies TRACXN
| SMA period | SMA current | SMA prev | SMA prev2 | | 5 day SMA | 52.86 | 53.06 | 53.37 | | 12 day SMA | 52.86 | 52.78 | 52.57 | | 20 day SMA | 51.85 | 51.73 | 51.62 | | 35 day SMA | 51.47 | 51.41 | 51.37 | | 50 day SMA | 51.32 | 51.31 | 51.32 | | 100 day SMA | 54.4 | 54.45 | 54.5 | | 150 day SMA | 54.82 | 54.84 | 54.82 | | 200 day SMA | 57.09 | 57.2 | 57.33 |
|
|
