TplPlastech TPLPLASTEH full analysis,charts,indicators,moving averages,SMA,DMA,EMA,ADX,MACD,RSITpl Plastech TPLPLASTEH WideScreen charts, DMA,SMA,EMA technical analysis, forecast prediction, by indicators ADX,MACD,RSI,CCI NSE stock exchange
operates under Fibres & Plastics sector
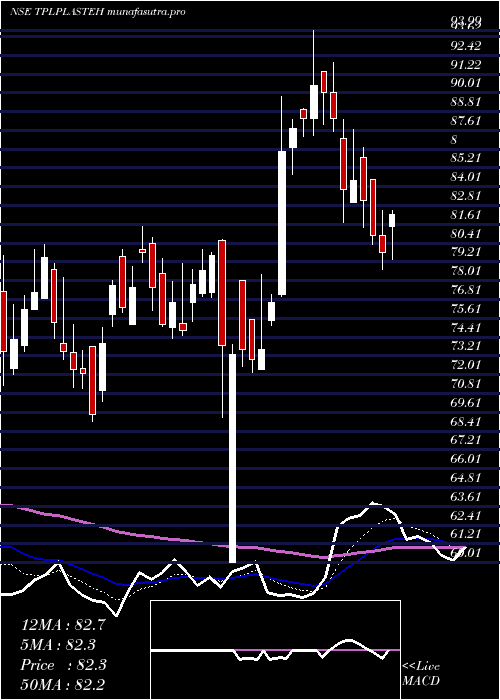
Daily price and charts and targets TplPlastech Strong Daily Stock price targets for TplPlastech TPLPLASTEH are 69.55 and 75.01 | Daily Target 1 | 65.42 | | Daily Target 2 | 68.21 | | Daily Target 3 | 70.883333333333 | | Daily Target 4 | 73.67 | | Daily Target 5 | 76.34 |
Daily price and volume Tpl Plastech
| Date |
Closing |
Open |
Range |
Volume |
Tue 28 October 2025 |
70.99 (4.17%) |
68.99 |
68.10 - 73.56 |
6.628 times |
Mon 27 October 2025 |
68.15 (-1.67%) |
68.50 |
67.63 - 69.79 |
0.4201 times |
Fri 24 October 2025 |
69.31 (-0.84%) |
71.15 |
69.00 - 71.15 |
0.1818 times |
Thu 23 October 2025 |
69.90 (0.43%) |
68.80 |
68.80 - 71.60 |
0.8955 times |
Tue 21 October 2025 |
69.60 (3.34%) |
68.44 |
67.36 - 70.10 |
0.1531 times |
Mon 20 October 2025 |
67.35 (-0.65%) |
67.79 |
65.26 - 68.49 |
0.3103 times |
Fri 17 October 2025 |
67.79 (-2.74%) |
70.80 |
67.50 - 70.80 |
0.582 times |
Thu 16 October 2025 |
69.70 (0.26%) |
70.39 |
69.04 - 71.30 |
0.2553 times |
Wed 15 October 2025 |
69.52 (-0.11%) |
69.99 |
68.50 - 71.99 |
0.3348 times |
Tue 14 October 2025 |
69.60 (-2.01%) |
71.05 |
69.15 - 71.06 |
0.239 times |
Mon 13 October 2025 |
71.03 (-0.55%) |
70.05 |
70.05 - 71.50 |
0.1372 times |
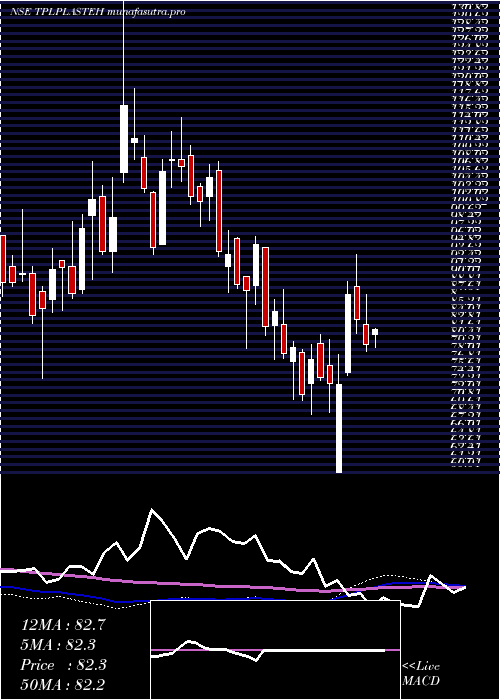
Weekly price and charts TplPlastech Strong weekly Stock price targets for TplPlastech TPLPLASTEH are 69.31 and 75.24 | Weekly Target 1 | 64.8 | | Weekly Target 2 | 67.89 | | Weekly Target 3 | 70.726666666667 | | Weekly Target 4 | 73.82 | | Weekly Target 5 | 76.66 |
Weekly price and volumes for Tpl Plastech
| Date |
Closing |
Open |
Range |
Volume |
Tue 28 October 2025 |
70.99 (2.42%) |
68.50 |
67.63 - 73.56 |
3.5905 times |
Fri 24 October 2025 |
69.31 (2.24%) |
67.79 |
65.26 - 71.60 |
0.7849 times |
Fri 17 October 2025 |
67.79 (-5.08%) |
70.05 |
67.50 - 71.99 |
0.7887 times |
Fri 10 October 2025 |
71.42 (-1.27%) |
72.51 |
70.55 - 74.44 |
0.6936 times |
Fri 03 October 2025 |
72.34 (-0.52%) |
73.00 |
71.29 - 73.49 |
0.5262 times |
Fri 26 September 2025 |
72.72 (-3.55%) |
75.11 |
71.52 - 76.49 |
0.6082 times |
Fri 19 September 2025 |
75.40 (0.75%) |
74.25 |
74.02 - 77.50 |
0.9276 times |
Fri 12 September 2025 |
74.84 (-0.33%) |
75.25 |
74.00 - 76.72 |
0.8217 times |
Fri 05 September 2025 |
75.09 (-2.1%) |
77.90 |
74.00 - 80.00 |
0.6534 times |
Fri 29 August 2025 |
76.70 (-4.54%) |
81.15 |
75.30 - 81.15 |
0.6052 times |
Fri 22 August 2025 |
80.35 (6.68%) |
75.32 |
75.26 - 81.90 |
1.2861 times |
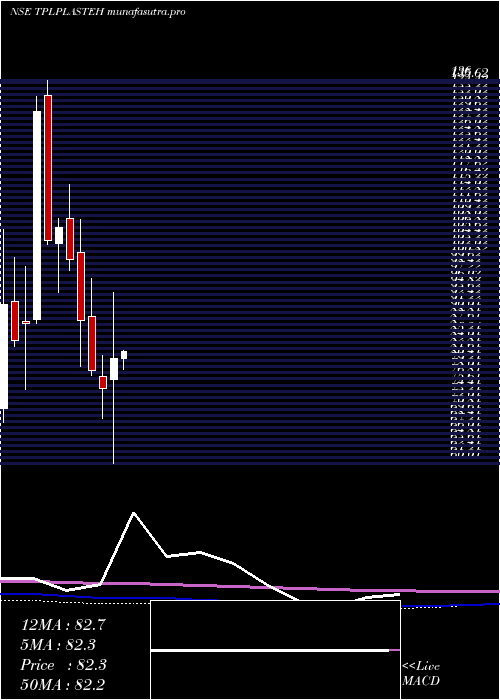
Monthly price and charts TplPlastech Strong monthly Stock price targets for TplPlastech TPLPLASTEH are 63.54 and 72.72 | Monthly Target 1 | 61.05 | | Monthly Target 2 | 66.02 | | Monthly Target 3 | 70.23 | | Monthly Target 4 | 75.2 | | Monthly Target 5 | 79.41 |
Monthly price and volumes Tpl Plastech
| Date |
Closing |
Open |
Range |
Volume |
Tue 28 October 2025 |
70.99 (-1.05%) |
71.49 |
65.26 - 74.44 |
0.4732 times |
Tue 30 September 2025 |
71.74 (-6.47%) |
77.90 |
71.38 - 80.00 |
0.2448 times |
Fri 29 August 2025 |
76.70 (-2.52%) |
78.00 |
71.60 - 81.90 |
0.3013 times |
Thu 31 July 2025 |
78.68 (-3.68%) |
81.89 |
74.42 - 83.44 |
0.8245 times |
Mon 30 June 2025 |
81.69 (-0.6%) |
82.00 |
76.91 - 87.69 |
1.6787 times |
Fri 30 May 2025 |
82.18 (1.59%) |
80.89 |
73.42 - 88.63 |
1.5064 times |
Wed 30 April 2025 |
80.89 (8.08%) |
76.63 |
60.01 - 93.99 |
0.7521 times |
Fri 28 March 2025 |
74.84 (-4.61%) |
77.30 |
69.01 - 81.45 |
0.7071 times |
Fri 28 February 2025 |
78.46 (-11.17%) |
89.12 |
77.54 - 96.75 |
1.5696 times |
Fri 31 January 2025 |
88.33 (-12.07%) |
101.91 |
79.35 - 108.44 |
1.9421 times |
Tue 31 December 2024 |
100.45 (-6%) |
108.65 |
98.38 - 115.37 |
2.0118 times |
DMA SMA EMA moving averages of Tpl Plastech TPLPLASTEH
DMA (daily moving average) of Tpl Plastech TPLPLASTEH
| DMA period | DMA value | | 5 day DMA | 69.59 | | 12 day DMA | 69.53 | | 20 day DMA | 70.43 | | 35 day DMA | 72.26 | | 50 day DMA | 73.7 | | 100 day DMA | 76.65 | | 150 day DMA | 78.01 | | 200 day DMA | 79.93 | EMA (exponential moving average) of Tpl Plastech TPLPLASTEH
| EMA period | EMA current | EMA prev | EMA prev2 | | 5 day EMA | 69.61 | 68.92 | 69.3 | | 12 day EMA | 69.83 | 69.62 | 69.89 | | 20 day EMA | 70.56 | 70.52 | 70.77 | | 35 day EMA | 71.89 | 71.94 | 72.16 | | 50 day EMA | 73.36 | 73.46 | 73.68 |
SMA (simple moving average) of Tpl Plastech TPLPLASTEH
| SMA period | SMA current | SMA prev | SMA prev2 | | 5 day SMA | 69.59 | 68.86 | 68.79 | | 12 day SMA | 69.53 | 69.53 | 69.75 | | 20 day SMA | 70.43 | 70.51 | 70.78 | | 35 day SMA | 72.26 | 72.38 | 72.61 | | 50 day SMA | 73.7 | 73.77 | 73.93 | | 100 day SMA | 76.65 | 76.76 | 76.89 | | 150 day SMA | 78.01 | 78.05 | 78.09 | | 200 day SMA | 79.93 | 80.07 | 80.26 |
|
|
