TataamlTnidetf TNIDETF full analysis,charts,indicators,moving averages,SMA,DMA,EMA,ADX,MACD,RSITataaml Tnidetf TNIDETF WideScreen charts, DMA,SMA,EMA technical analysis, forecast prediction, by indicators ADX,MACD,RSI,CCI NSE stock exchange
Daily price and charts and targets TataamlTnidetf Strong Daily Stock price targets for TataamlTnidetf TNIDETF are 96.4 and 97.32 | Daily Target 1 | 96.18 | | Daily Target 2 | 96.61 | | Daily Target 3 | 97.103333333333 | | Daily Target 4 | 97.53 | | Daily Target 5 | 98.02 |
Daily price and volume Tataaml Tnidetf
| Date |
Closing |
Open |
Range |
Volume |
Wed 29 October 2025 |
97.03 (0.01%) |
97.50 |
96.68 - 97.60 |
0.5361 times |
Tue 28 October 2025 |
97.02 (-0.21%) |
97.35 |
95.98 - 97.60 |
1.3833 times |
Mon 27 October 2025 |
97.22 (1.39%) |
95.89 |
95.52 - 97.50 |
1.3178 times |
Fri 24 October 2025 |
95.89 (-0.39%) |
96.75 |
95.31 - 96.75 |
1.2081 times |
Thu 23 October 2025 |
96.27 (1.02%) |
95.30 |
95.30 - 97.00 |
1.6552 times |
Tue 21 October 2025 |
95.30 (0.29%) |
95.50 |
94.70 - 97.97 |
0.1688 times |
Mon 20 October 2025 |
95.02 (0.21%) |
95.30 |
94.24 - 96.49 |
0.3743 times |
Fri 17 October 2025 |
94.82 (-0.96%) |
96.90 |
94.60 - 96.90 |
0.5882 times |
Thu 16 October 2025 |
95.74 (0.48%) |
95.66 |
94.81 - 96.30 |
1.0849 times |
Wed 15 October 2025 |
95.28 (1.07%) |
94.74 |
94.21 - 95.67 |
1.6833 times |
Tue 14 October 2025 |
94.27 (-0.46%) |
95.18 |
94.07 - 95.66 |
0.3635 times |
Weekly price and charts TataamlTnidetf Strong weekly Stock price targets for TataamlTnidetf TNIDETF are 96.28 and 98.36 | Weekly Target 1 | 94.64 | | Weekly Target 2 | 95.83 | | Weekly Target 3 | 96.716666666667 | | Weekly Target 4 | 97.91 | | Weekly Target 5 | 98.8 |
Weekly price and volumes for Tataaml Tnidetf
| Date |
Closing |
Open |
Range |
Volume |
Wed 29 October 2025 |
97.03 (1.19%) |
95.89 |
95.52 - 97.60 |
0.6644 times |
Fri 24 October 2025 |
95.89 (1.13%) |
95.30 |
94.24 - 97.97 |
0.6992 times |
Fri 17 October 2025 |
94.82 (-0.49%) |
95.73 |
93.86 - 96.90 |
1.0757 times |
Fri 10 October 2025 |
95.29 (4.23%) |
93.40 |
91.06 - 97.30 |
0.826 times |
Fri 03 October 2025 |
91.42 (1.13%) |
91.39 |
90.01 - 93.98 |
1.6276 times |
Fri 26 September 2025 |
90.40 (-5.87%) |
95.95 |
90.00 - 95.95 |
1.1726 times |
Fri 19 September 2025 |
96.04 (1.81%) |
94.80 |
92.14 - 96.92 |
0.9581 times |
Fri 12 September 2025 |
94.33 (1.98%) |
92.50 |
92.15 - 95.18 |
1.2951 times |
Fri 05 September 2025 |
92.50 (0.66%) |
89.59 |
89.59 - 95.01 |
0.9925 times |
Fri 29 August 2025 |
91.89 (-2.29%) |
94.51 |
91.60 - 95.35 |
0.6888 times |
Fri 22 August 2025 |
94.04 (2.59%) |
90.10 |
90.10 - 97.38 |
0.8279 times |
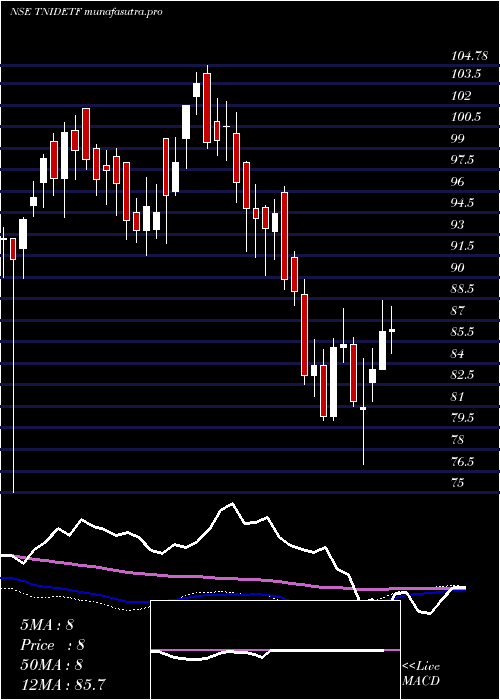
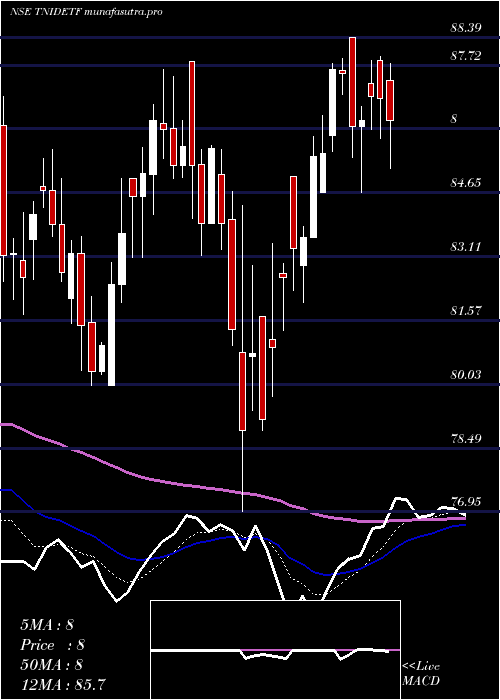
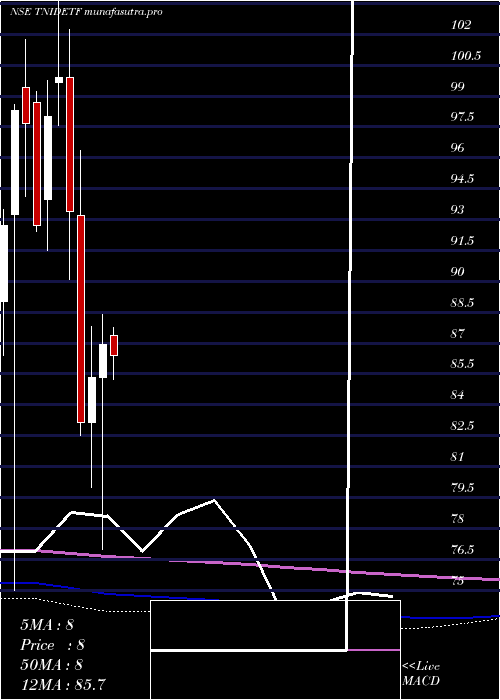
Monthly price and charts TataamlTnidetf Strong monthly Stock price targets for TataamlTnidetf TNIDETF are 93.52 and 101.48 | Monthly Target 1 | 87.04 | | Monthly Target 2 | 92.04 | | Monthly Target 3 | 95.003333333333 | | Monthly Target 4 | 100 | | Monthly Target 5 | 102.96 |
Monthly price and volumes Tataaml Tnidetf
| Date |
Closing |
Open |
Range |
Volume |
Wed 29 October 2025 |
97.03 (3.94%) |
93.67 |
90.01 - 97.97 |
0.8285 times |
Tue 30 September 2025 |
93.35 (1.59%) |
89.59 |
89.59 - 96.92 |
0.9201 times |
Fri 29 August 2025 |
91.89 (0.01%) |
92.33 |
88.70 - 97.38 |
0.6685 times |
Thu 31 July 2025 |
91.88 (-3.1%) |
97.19 |
90.60 - 97.19 |
1.0425 times |
Mon 30 June 2025 |
94.82 (5.18%) |
89.70 |
87.63 - 97.60 |
0.9998 times |
Fri 30 May 2025 |
90.15 (3.7%) |
87.35 |
84.41 - 92.28 |
1.7019 times |
Wed 30 April 2025 |
86.93 (1.9%) |
85.33 |
76.95 - 88.39 |
0.9608 times |
Fri 28 March 2025 |
85.31 (2.61%) |
83.15 |
80.00 - 87.80 |
0.981 times |
Fri 28 February 2025 |
83.14 (-10.96%) |
93.20 |
82.51 - 96.35 |
1.0072 times |
Fri 31 January 2025 |
93.37 (-6.55%) |
99.91 |
90.10 - 102.24 |
0.8897 times |
Tue 31 December 2024 |
99.91 (1.94%) |
99.68 |
97.57 - 104.78 |
1.8162 times |
DMA SMA EMA moving averages of Tataaml Tnidetf TNIDETF
DMA (daily moving average) of Tataaml Tnidetf TNIDETF
| DMA period | DMA value | | 5 day DMA | 96.69 | | 12 day DMA | 95.71 | | 20 day DMA | 94.79 | | 35 day DMA | 94.48 | | 50 day DMA | 94.1 | | 100 day DMA | 93.41 | | 150 day DMA | 91.19 | | 200 day DMA | 90.83 | EMA (exponential moving average) of Tataaml Tnidetf TNIDETF
| EMA period | EMA current | EMA prev | EMA prev2 | | 5 day EMA | 96.64 | 96.44 | 96.15 | | 12 day EMA | 95.86 | 95.65 | 95.4 | | 20 day EMA | 95.27 | 95.09 | 94.89 | | 35 day EMA | 94.59 | 94.45 | 94.3 | | 50 day EMA | 94.08 | 93.96 | 93.83 |
SMA (simple moving average) of Tataaml Tnidetf TNIDETF
| SMA period | SMA current | SMA prev | SMA prev2 | | 5 day SMA | 96.69 | 96.34 | 95.94 | | 12 day SMA | 95.71 | 95.57 | 95.41 | | 20 day SMA | 94.79 | 94.57 | 94.24 | | 35 day SMA | 94.48 | 94.34 | 94.21 | | 50 day SMA | 94.1 | 94 | 93.88 | | 100 day SMA | 93.41 | 93.36 | 93.29 | | 150 day SMA | 91.19 | 91.1 | 91.01 | | 200 day SMA | 90.83 | 90.83 | 90.85 |
|
|
