ThirumalaiChemicals TIRUMALCHM full analysis,charts,indicators,moving averages,SMA,DMA,EMA,ADX,MACD,RSIThirumalai Chemicals TIRUMALCHM WideScreen charts, DMA,SMA,EMA technical analysis, forecast prediction, by indicators ADX,MACD,RSI,CCI NSE stock exchange
operates under Commodity Chemicals sector
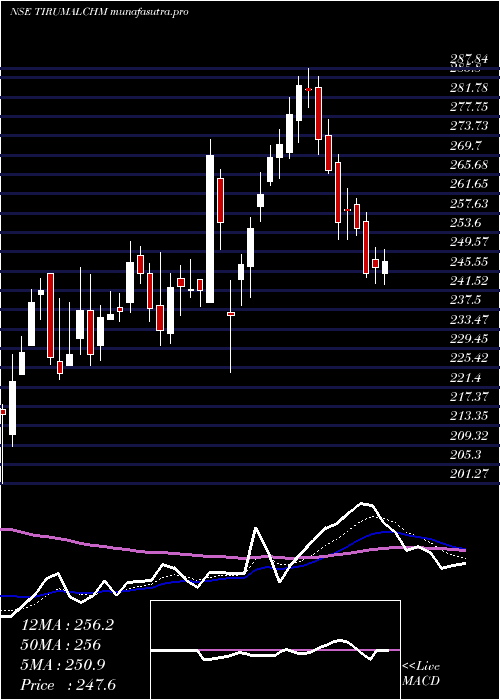
Daily price and charts and targets ThirumalaiChemicals Strong Daily Stock price targets for ThirumalaiChemicals TIRUMALCHM are 279.45 and 293.1 | Daily Target 1 | 269.58 | | Daily Target 2 | 275.67 | | Daily Target 3 | 283.23333333333 | | Daily Target 4 | 289.32 | | Daily Target 5 | 296.88 |
Daily price and volume Thirumalai Chemicals
| Date |
Closing |
Open |
Range |
Volume |
Wed 29 October 2025 |
281.75 (1.4%) |
279.15 |
277.15 - 290.80 |
1.7759 times |
Tue 28 October 2025 |
277.85 (-2.25%) |
282.80 |
277.05 - 283.00 |
0.7659 times |
Mon 27 October 2025 |
284.25 (-1.39%) |
290.05 |
281.10 - 290.55 |
0.938 times |
Fri 24 October 2025 |
288.25 (2.73%) |
283.50 |
281.65 - 293.75 |
2.9146 times |
Thu 23 October 2025 |
280.60 (0.12%) |
283.35 |
278.80 - 283.75 |
0.885 times |
Tue 21 October 2025 |
280.25 (1.16%) |
279.80 |
279.00 - 282.00 |
0.2133 times |
Mon 20 October 2025 |
277.05 (0.25%) |
275.00 |
274.95 - 283.20 |
0.6369 times |
Fri 17 October 2025 |
276.35 (-0.4%) |
276.45 |
273.60 - 278.00 |
0.6118 times |
Thu 16 October 2025 |
277.45 (0.31%) |
278.05 |
275.55 - 282.40 |
0.5617 times |
Wed 15 October 2025 |
276.60 (0.67%) |
275.90 |
273.45 - 279.50 |
0.6969 times |
Tue 14 October 2025 |
274.75 (-1.73%) |
279.90 |
273.20 - 289.25 |
1.0759 times |
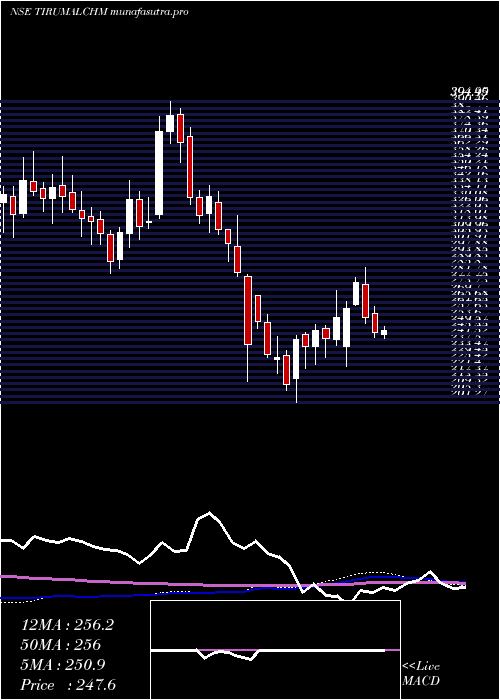
Weekly price and charts ThirumalaiChemicals Strong weekly Stock price targets for ThirumalaiChemicals TIRUMALCHM are 272.53 and 286.28 | Weekly Target 1 | 269.45 | | Weekly Target 2 | 275.6 | | Weekly Target 3 | 283.2 | | Weekly Target 4 | 289.35 | | Weekly Target 5 | 296.95 |
Weekly price and volumes for Thirumalai Chemicals
| Date |
Closing |
Open |
Range |
Volume |
Wed 29 October 2025 |
281.75 (-2.25%) |
290.05 |
277.05 - 290.80 |
0.6587 times |
Fri 24 October 2025 |
288.25 (4.31%) |
275.00 |
274.95 - 293.75 |
0.8801 times |
Fri 17 October 2025 |
276.35 (-0.54%) |
277.75 |
273.20 - 289.25 |
0.6665 times |
Fri 10 October 2025 |
277.85 (-2.47%) |
284.90 |
276.30 - 288.35 |
0.6648 times |
Fri 03 October 2025 |
284.90 (-2.73%) |
291.50 |
276.30 - 293.90 |
0.9935 times |
Fri 26 September 2025 |
292.90 (-9.81%) |
320.00 |
285.05 - 324.00 |
0.8281 times |
Fri 19 September 2025 |
324.75 (2.96%) |
317.10 |
312.80 - 328.80 |
1.0881 times |
Fri 12 September 2025 |
315.40 (3.07%) |
306.00 |
298.50 - 323.80 |
1.7009 times |
Fri 05 September 2025 |
306.00 (5.05%) |
293.65 |
291.50 - 313.95 |
1.3418 times |
Fri 29 August 2025 |
291.30 (3.06%) |
288.50 |
279.00 - 305.00 |
1.1773 times |
Fri 22 August 2025 |
282.65 (-0.98%) |
274.95 |
273.90 - 301.65 |
1.2296 times |
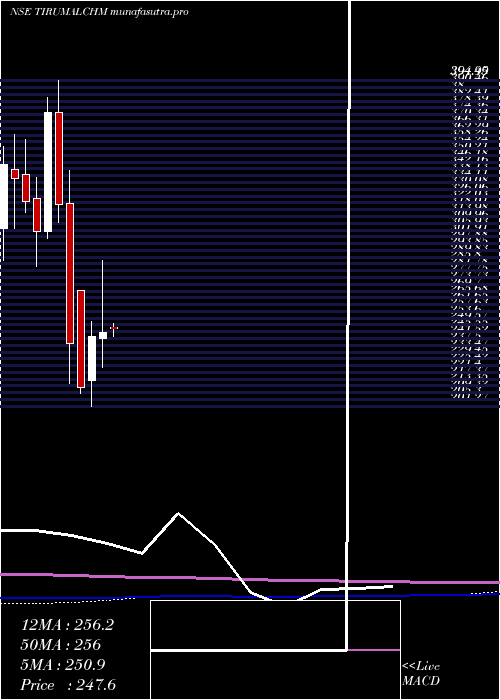
Monthly price and charts ThirumalaiChemicals Strong monthly Stock price targets for ThirumalaiChemicals TIRUMALCHM are 277.48 and 298.03 | Monthly Target 1 | 262.35 | | Monthly Target 2 | 272.05 | | Monthly Target 3 | 282.9 | | Monthly Target 4 | 292.6 | | Monthly Target 5 | 303.45 |
Monthly price and volumes Thirumalai Chemicals
| Date |
Closing |
Open |
Range |
Volume |
Wed 29 October 2025 |
281.75 (0.28%) |
278.55 |
273.20 - 293.75 |
0.52 times |
Tue 30 September 2025 |
280.95 (-3.55%) |
293.65 |
276.30 - 328.80 |
0.9099 times |
Fri 29 August 2025 |
291.30 (-2.58%) |
299.00 |
273.90 - 305.00 |
0.7223 times |
Thu 31 July 2025 |
299.00 (1.88%) |
293.95 |
278.55 - 318.95 |
1.5834 times |
Mon 30 June 2025 |
293.48 (17.49%) |
251.00 |
247.51 - 301.70 |
2.1029 times |
Fri 30 May 2025 |
249.80 (1.95%) |
248.00 |
230.00 - 272.00 |
0.6923 times |
Wed 30 April 2025 |
245.03 (1.07%) |
241.50 |
224.36 - 287.84 |
0.913 times |
Fri 28 March 2025 |
242.43 (14.05%) |
216.65 |
201.27 - 251.70 |
1.0609 times |
Fri 28 February 2025 |
212.56 (-10.86%) |
270.02 |
209.00 - 270.02 |
0.5776 times |
Fri 31 January 2025 |
238.45 (-25.67%) |
321.75 |
214.90 - 341.00 |
0.9176 times |
Tue 31 December 2024 |
320.80 (-14.59%) |
375.60 |
310.30 - 394.95 |
1.0838 times |
DMA SMA EMA moving averages of Thirumalai Chemicals TIRUMALCHM
DMA (daily moving average) of Thirumalai Chemicals TIRUMALCHM
| DMA period | DMA value | | 5 day DMA | 282.54 | | 12 day DMA | 279.56 | | 20 day DMA | 280.67 | | 35 day DMA | 293.64 | | 50 day DMA | 294 | | 100 day DMA | 292.06 | | 150 day DMA | 279.7 | | 200 day DMA | 273.56 | EMA (exponential moving average) of Thirumalai Chemicals TIRUMALCHM
| EMA period | EMA current | EMA prev | EMA prev2 | | 5 day EMA | 281.36 | 281.16 | 282.82 | | 12 day EMA | 281.59 | 281.56 | 282.24 | | 20 day EMA | 283.79 | 284 | 284.65 | | 35 day EMA | 286.91 | 287.21 | 287.76 | | 50 day EMA | 292.22 | 292.65 | 293.25 |
SMA (simple moving average) of Thirumalai Chemicals TIRUMALCHM
| SMA period | SMA current | SMA prev | SMA prev2 | | 5 day SMA | 282.54 | 282.24 | 282.08 | | 12 day SMA | 279.56 | 279.24 | 279.38 | | 20 day SMA | 280.67 | 280.65 | 281.4 | | 35 day SMA | 293.64 | 294.39 | 295.19 | | 50 day SMA | 294 | 294.08 | 294.25 | | 100 day SMA | 292.06 | 291.93 | 291.87 | | 150 day SMA | 279.7 | 279.4 | 279.13 | | 200 day SMA | 273.56 | 273.81 | 274.01 |
|
|
