TinnaRubber TINNARUBR full analysis,charts,indicators,moving averages,SMA,DMA,EMA,ADX,MACD,RSITinna Rubber TINNARUBR WideScreen charts, DMA,SMA,EMA technical analysis, forecast prediction, by indicators ADX,MACD,RSI,CCI NSE stock exchange
Daily price and charts and targets TinnaRubber Strong Daily Stock price targets for TinnaRubber TINNARUBR are 965.53 and 981.68 | Daily Target 1 | 962.38 | | Daily Target 2 | 968.67 | | Daily Target 3 | 978.53333333333 | | Daily Target 4 | 984.82 | | Daily Target 5 | 994.68 |
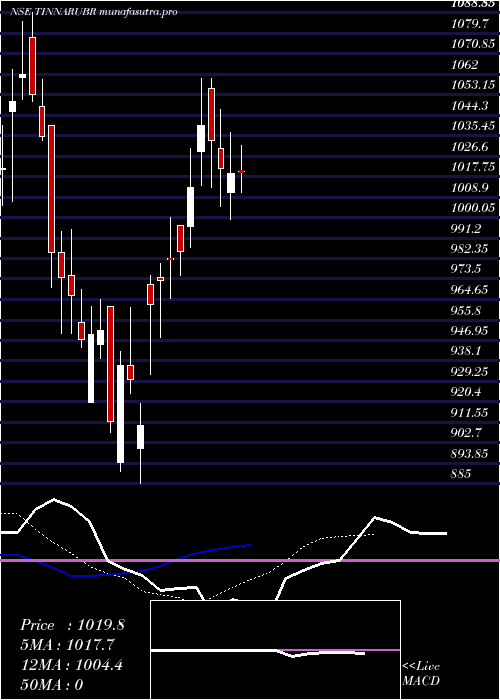
Daily price and volume Tinna Rubber
| Date |
Closing |
Open |
Range |
Volume |
Tue 28 October 2025 |
974.95 (-0.06%) |
975.00 |
972.25 - 988.40 |
0.6102 times |
Mon 27 October 2025 |
975.50 (-0.08%) |
976.25 |
969.00 - 1003.00 |
1.7917 times |
Fri 24 October 2025 |
976.25 (-0.45%) |
980.70 |
965.25 - 988.00 |
0.6824 times |
Thu 23 October 2025 |
980.70 (-2.06%) |
1009.90 |
970.05 - 1011.90 |
1.0308 times |
Tue 21 October 2025 |
1001.30 (1.78%) |
993.80 |
987.30 - 1006.60 |
0.6268 times |
Mon 20 October 2025 |
983.80 (1.18%) |
989.00 |
971.50 - 995.00 |
0.6897 times |
Fri 17 October 2025 |
972.35 (-1.04%) |
990.00 |
963.05 - 990.00 |
0.8078 times |
Thu 16 October 2025 |
982.60 (-1.57%) |
999.95 |
980.40 - 1006.40 |
1.1023 times |
Wed 15 October 2025 |
998.30 (2.07%) |
971.50 |
967.20 - 1004.90 |
1.1638 times |
Tue 14 October 2025 |
978.05 (-1.75%) |
995.50 |
962.00 - 995.95 |
1.4947 times |
Mon 13 October 2025 |
995.50 (-2.93%) |
1020.00 |
976.05 - 1022.90 |
2.1905 times |
Weekly price and charts TinnaRubber Strong weekly Stock price targets for TinnaRubber TINNARUBR are 954.98 and 988.98 | Weekly Target 1 | 948.32 | | Weekly Target 2 | 961.63 | | Weekly Target 3 | 982.31666666667 | | Weekly Target 4 | 995.63 | | Weekly Target 5 | 1016.32 |
Weekly price and volumes for Tinna Rubber
| Date |
Closing |
Open |
Range |
Volume |
Tue 28 October 2025 |
974.95 (-0.13%) |
976.25 |
969.00 - 1003.00 |
0.2158 times |
Fri 24 October 2025 |
976.25 (0.4%) |
989.00 |
965.25 - 1011.90 |
0.2722 times |
Fri 17 October 2025 |
972.35 (-5.18%) |
1020.00 |
962.00 - 1022.90 |
0.6073 times |
Fri 10 October 2025 |
1025.50 (4.64%) |
995.00 |
985.00 - 1068.60 |
1.2676 times |
Fri 03 October 2025 |
980.00 (5.62%) |
927.85 |
927.85 - 1002.60 |
0.7435 times |
Fri 26 September 2025 |
927.85 (11.71%) |
830.60 |
830.55 - 1006.40 |
5.6947 times |
Fri 19 September 2025 |
830.60 (1.72%) |
822.80 |
817.00 - 843.05 |
0.3253 times |
Fri 12 September 2025 |
816.55 (0.23%) |
825.00 |
805.05 - 843.00 |
0.2558 times |
Fri 05 September 2025 |
814.70 (1.63%) |
801.65 |
799.05 - 845.35 |
0.3591 times |
Fri 29 August 2025 |
801.65 (-5.14%) |
874.00 |
796.15 - 874.00 |
0.2587 times |
Fri 22 August 2025 |
845.05 (3.86%) |
825.60 |
795.00 - 858.00 |
0.4292 times |

Monthly price and charts TinnaRubber Strong monthly Stock price targets for TinnaRubber TINNARUBR are 955.5 and 1088.05 | Monthly Target 1 | 860.65 | | Monthly Target 2 | 917.8 | | Monthly Target 3 | 993.2 | | Monthly Target 4 | 1050.35 | | Monthly Target 5 | 1125.75 |
Monthly price and volumes Tinna Rubber
| Date |
Closing |
Open |
Range |
Volume |
Tue 28 October 2025 |
974.95 (3.5%) |
941.95 |
936.05 - 1068.60 |
0.9999 times |
Tue 30 September 2025 |
941.95 (17.5%) |
801.65 |
799.05 - 1006.40 |
2.6549 times |
Fri 29 August 2025 |
801.65 (-11.72%) |
905.00 |
795.00 - 957.40 |
0.6153 times |
Thu 31 July 2025 |
908.05 (-5.11%) |
952.35 |
899.95 - 1032.95 |
1.3376 times |
Mon 30 June 2025 |
957.00 (-1.29%) |
967.60 |
905.00 - 1019.00 |
0.6412 times |
Fri 30 May 2025 |
969.55 (2.36%) |
920.05 |
885.00 - 1060.25 |
0.5663 times |
Wed 30 April 2025 |
947.15 (0%) |
1021.00 |
943.95 - 1088.85 |
0.1849 times |
Wed 29 October 2025 |
(0%) |
|
- |
0 times |

DMA SMA EMA moving averages of Tinna Rubber TINNARUBR
DMA (daily moving average) of Tinna Rubber TINNARUBR
| DMA period | DMA value | | 5 day DMA | 981.74 | | 12 day DMA | 987.07 | | 20 day DMA | 991.34 | | 35 day DMA | 938.17 | | 50 day DMA | 902.38 | | 100 day DMA | 914.64 | | 150 day DMA | | | 200 day DMA | | EMA (exponential moving average) of Tinna Rubber TINNARUBR
| EMA period | EMA current | EMA prev | EMA prev2 | | 5 day EMA | 979 | 981.02 | 983.78 | | 12 day EMA | 982.06 | 983.35 | 984.78 | | 20 day EMA | 972.8 | 972.57 | 972.26 | | 35 day EMA | 943.61 | 941.76 | 939.77 | | 50 day EMA | 906.23 | 903.43 | 900.49 |
SMA (simple moving average) of Tinna Rubber TINNARUBR
| SMA period | SMA current | SMA prev | SMA prev2 | | 5 day SMA | 981.74 | 983.51 | 982.88 | | 12 day SMA | 987.07 | 990.57 | 996.29 | | 20 day SMA | 991.34 | 988.98 | 987 | | 35 day SMA | 938.17 | 933.59 | 929.14 | | 50 day SMA | 902.38 | 899.56 | 896.98 | | 100 day SMA | 914.64 | 914.39 | 914.09 | | 150 day SMA | | 200 day SMA |
|
|
