TimkenIndia TIMKEN full analysis,charts,indicators,moving averages,SMA,DMA,EMA,ADX,MACD,RSITimken India TIMKEN WideScreen charts, DMA,SMA,EMA technical analysis, forecast prediction, by indicators ADX,MACD,RSI,CCI NSE stock exchange
operates under Industrial Machinery sector
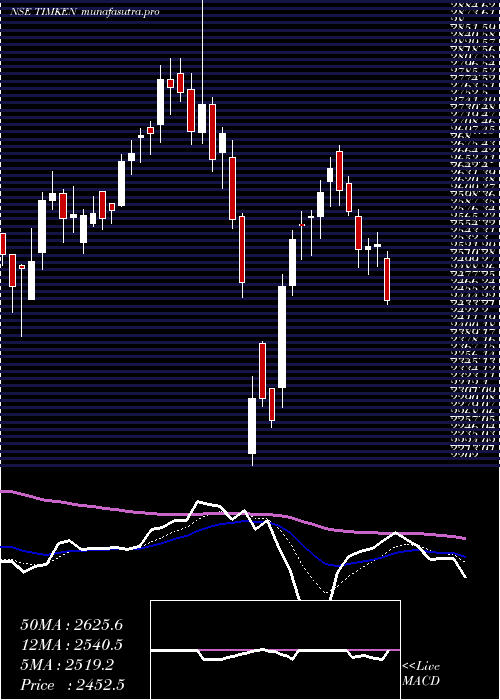
Daily price and charts and targets TimkenIndia Strong Daily Stock price targets for TimkenIndia TIMKEN are 3029.2 and 3058 | Daily Target 1 | 3006.93 | | Daily Target 2 | 3022.67 | | Daily Target 3 | 3035.7333333333 | | Daily Target 4 | 3051.47 | | Daily Target 5 | 3064.53 |
Daily price and volume Timken India
| Date |
Closing |
Open |
Range |
Volume |
Tue 28 October 2025 |
3038.40 (0.54%) |
3022.00 |
3020.00 - 3048.80 |
0.2789 times |
Mon 27 October 2025 |
3022.00 (1.1%) |
2975.10 |
2972.60 - 3028.70 |
0.3919 times |
Fri 24 October 2025 |
2989.20 (0.24%) |
2982.10 |
2968.70 - 2997.50 |
0.2338 times |
Thu 23 October 2025 |
2982.10 (0.68%) |
2962.60 |
2931.10 - 2990.00 |
0.4844 times |
Tue 21 October 2025 |
2961.90 (1.17%) |
2936.60 |
2935.10 - 2975.00 |
0.042 times |
Mon 20 October 2025 |
2927.70 (-1.01%) |
2957.70 |
2907.10 - 2957.70 |
0.4926 times |
Fri 17 October 2025 |
2957.70 (0.36%) |
2954.60 |
2918.60 - 2972.00 |
0.3294 times |
Thu 16 October 2025 |
2947.20 (0.61%) |
2942.60 |
2911.70 - 2953.80 |
1.3444 times |
Wed 15 October 2025 |
2929.30 (0.68%) |
2932.00 |
2890.00 - 2975.00 |
5.4721 times |
Tue 14 October 2025 |
2909.40 (-0.71%) |
2930.20 |
2885.50 - 2956.00 |
0.9305 times |
Mon 13 October 2025 |
2930.20 (-1.85%) |
2955.00 |
2909.00 - 2987.90 |
1.7963 times |
Weekly price and charts TimkenIndia Strong weekly Stock price targets for TimkenIndia TIMKEN are 3005.5 and 3081.7 | Weekly Target 1 | 2943.73 | | Weekly Target 2 | 2991.07 | | Weekly Target 3 | 3019.9333333333 | | Weekly Target 4 | 3067.27 | | Weekly Target 5 | 3096.13 |
Weekly price and volumes for Timken India
| Date |
Closing |
Open |
Range |
Volume |
Tue 28 October 2025 |
3038.40 (1.65%) |
2975.10 |
2972.60 - 3048.80 |
0.1521 times |
Fri 24 October 2025 |
2989.20 (1.07%) |
2957.70 |
2907.10 - 2997.50 |
0.2841 times |
Fri 17 October 2025 |
2957.70 (-0.92%) |
2955.00 |
2885.50 - 2987.90 |
2.2385 times |
Fri 10 October 2025 |
2985.30 (-2.95%) |
3052.60 |
2938.60 - 3072.20 |
0.3931 times |
Fri 03 October 2025 |
3076.00 (2.59%) |
2984.60 |
2937.20 - 3091.60 |
0.5715 times |
Fri 26 September 2025 |
2998.20 (-1.45%) |
3057.30 |
2952.10 - 3076.00 |
0.9395 times |
Fri 19 September 2025 |
3042.30 (0.54%) |
3049.40 |
3015.60 - 3066.80 |
0.6112 times |
Fri 12 September 2025 |
3025.90 (5.16%) |
2878.00 |
2853.10 - 3060.00 |
1.6658 times |
Fri 05 September 2025 |
2877.50 (-0.37%) |
2923.00 |
2843.00 - 2954.70 |
2.2562 times |
Fri 29 August 2025 |
2888.20 (-3.78%) |
3032.60 |
2843.10 - 3110.00 |
0.8882 times |
Fri 22 August 2025 |
3001.70 (5.85%) |
2850.00 |
2831.20 - 3036.90 |
1.6664 times |
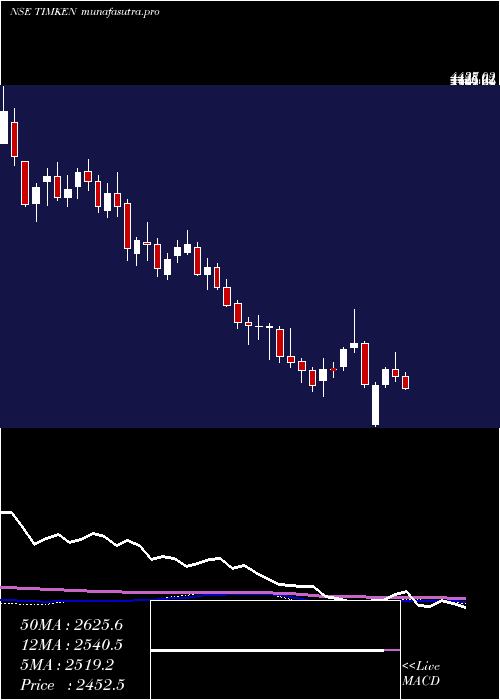
Monthly price and charts TimkenIndia Strong monthly Stock price targets for TimkenIndia TIMKEN are 2961.95 and 3168.05 | Monthly Target 1 | 2799.07 | | Monthly Target 2 | 2918.73 | | Monthly Target 3 | 3005.1666666667 | | Monthly Target 4 | 3124.83 | | Monthly Target 5 | 3211.27 |
Monthly price and volumes Timken India
| Date |
Closing |
Open |
Range |
Volume |
Tue 28 October 2025 |
3038.40 (0.95%) |
3001.90 |
2885.50 - 3091.60 |
0.3521 times |
Tue 30 September 2025 |
3009.90 (4.21%) |
2923.00 |
2843.00 - 3076.00 |
0.6248 times |
Fri 29 August 2025 |
2888.20 (-12.98%) |
3297.00 |
2831.20 - 3297.00 |
0.6012 times |
Thu 31 July 2025 |
3318.90 (-5.13%) |
3520.50 |
3278.00 - 3575.00 |
0.875 times |
Mon 30 June 2025 |
3498.30 (11.96%) |
3120.00 |
3101.70 - 3524.70 |
1.0841 times |
Fri 30 May 2025 |
3124.60 (27.4%) |
2467.80 |
2431.00 - 3225.00 |
2.826 times |
Wed 30 April 2025 |
2452.50 (-10.84%) |
2750.00 |
2202.00 - 2760.25 |
0.5425 times |
Fri 28 March 2025 |
2750.65 (11.17%) |
2505.45 |
2398.30 - 2972.00 |
1.1643 times |
Fri 28 February 2025 |
2474.20 (-13.42%) |
2840.95 |
2435.00 - 2862.65 |
1.2017 times |
Fri 31 January 2025 |
2857.80 (-8.46%) |
3114.35 |
2641.00 - 3127.35 |
0.7284 times |
Tue 31 December 2024 |
3121.80 (-7.6%) |
3348.50 |
3012.55 - 3492.40 |
0.3673 times |

DMA SMA EMA moving averages of Timken India TIMKEN
DMA (daily moving average) of Timken India TIMKEN
| DMA period | DMA value | | 5 day DMA | 2998.72 | | 12 day DMA | 2965.03 | | 20 day DMA | 2986.22 | | 35 day DMA | 3000.98 | | 50 day DMA | 2977.8 | | 100 day DMA | 3133.36 | | 150 day DMA | 3012.2 | | 200 day DMA | 2935.4 | EMA (exponential moving average) of Timken India TIMKEN
| EMA period | EMA current | EMA prev | EMA prev2 | | 5 day EMA | 3004.2 | 2987.11 | 2969.67 | | 12 day EMA | 2986.55 | 2977.13 | 2968.98 | | 20 day EMA | 2985.15 | 2979.55 | 2975.08 | | 35 day EMA | 2975.01 | 2971.28 | 2968.29 | | 50 day EMA | 2971.52 | 2968.79 | 2966.62 |
SMA (simple moving average) of Timken India TIMKEN
| SMA period | SMA current | SMA prev | SMA prev2 | | 5 day SMA | 2998.72 | 2976.58 | 2963.72 | | 12 day SMA | 2965.03 | 2960.17 | 2954.82 | | 20 day SMA | 2986.22 | 2984.21 | 2984.78 | | 35 day SMA | 3000.98 | 2996.38 | 2992.21 | | 50 day SMA | 2977.8 | 2974.07 | 2971.46 | | 100 day SMA | 3133.36 | 3135.71 | 3137.95 | | 150 day SMA | 3012.2 | 3009.78 | 3007.39 | | 200 day SMA | 2935.4 | 2934.9 | 2934.8 |
|
|
