TimesGuaranty TIMESGTY full analysis,charts,indicators,moving averages,SMA,DMA,EMA,ADX,MACD,RSITimes Guaranty TIMESGTY WideScreen charts, DMA,SMA,EMA technical analysis, forecast prediction, by indicators ADX,MACD,RSI,CCI NSE stock exchange
operates under Finance (including NBFCs) sector
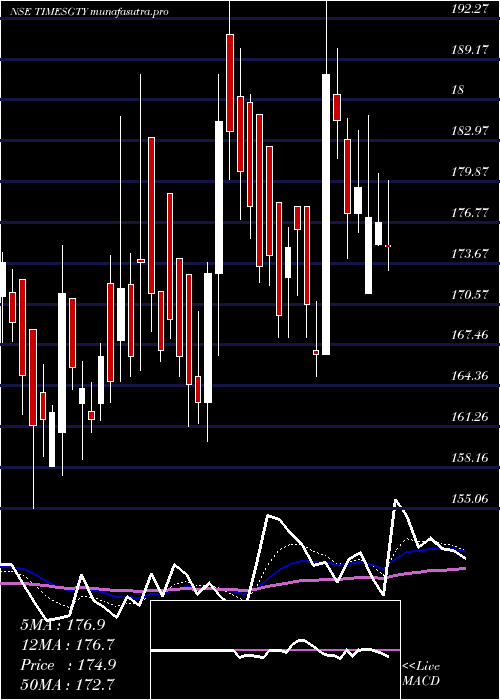
Daily price and charts and targets TimesGuaranty Strong Daily Stock price targets for TimesGuaranty TIMESGTY are 234.65 and 280.02 | Daily Target 1 | 227.08 | | Daily Target 2 | 242.21 | | Daily Target 3 | 272.45333333333 | | Daily Target 4 | 287.58 | | Daily Target 5 | 317.82 |
Daily price and volume Times Guaranty
| Date |
Closing |
Open |
Range |
Volume |
Wed 30 July 2025 |
257.33 (-10%) |
283.99 |
257.33 - 302.70 |
1.6192 times |
Tue 29 July 2025 |
285.93 (18.58%) |
243.50 |
240.00 - 289.34 |
3.8697 times |
Mon 28 July 2025 |
241.12 (9.16%) |
223.00 |
222.00 - 265.05 |
2.3299 times |
Fri 25 July 2025 |
220.88 (14.27%) |
193.30 |
192.00 - 227.70 |
1.3456 times |
Thu 24 July 2025 |
193.30 (2.85%) |
194.50 |
187.00 - 195.28 |
0.0537 times |
Wed 23 July 2025 |
187.95 (-1.4%) |
192.99 |
187.00 - 192.99 |
0.0199 times |
Tue 22 July 2025 |
190.62 (-1.2%) |
192.99 |
186.42 - 196.00 |
0.0829 times |
Mon 21 July 2025 |
192.94 (6.31%) |
188.48 |
186.00 - 204.70 |
0.6077 times |
Fri 18 July 2025 |
181.48 (4.53%) |
174.00 |
172.02 - 185.00 |
0.0488 times |
Thu 17 July 2025 |
173.62 (-0.75%) |
175.00 |
172.20 - 176.98 |
0.0226 times |
Wed 16 July 2025 |
174.94 (-1.05%) |
175.01 |
173.15 - 179.94 |
0.022 times |
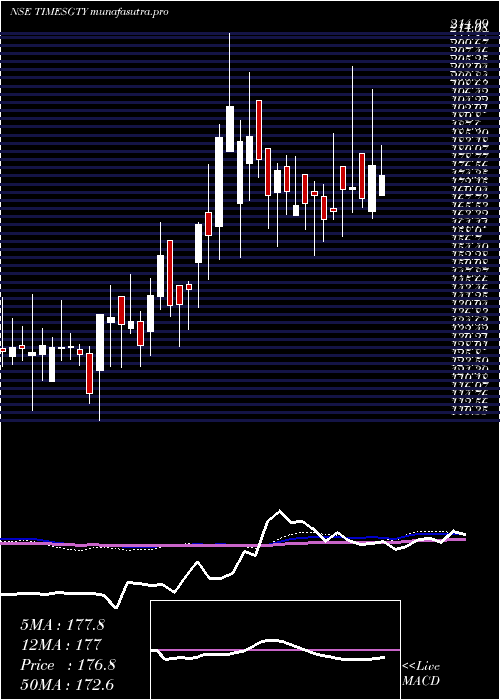
Weekly price and charts TimesGuaranty Strong weekly Stock price targets for TimesGuaranty TIMESGTY are 239.67 and 320.37 | Weekly Target 1 | 179.98 | | Weekly Target 2 | 218.65 | | Weekly Target 3 | 260.67666666667 | | Weekly Target 4 | 299.35 | | Weekly Target 5 | 341.38 |
Weekly price and volumes for Times Guaranty
| Date |
Closing |
Open |
Range |
Volume |
Wed 30 July 2025 |
257.33 (16.5%) |
223.00 |
222.00 - 302.70 |
6.0902 times |
Fri 25 July 2025 |
220.88 (21.71%) |
188.48 |
186.00 - 227.70 |
1.6434 times |
Fri 18 July 2025 |
181.48 (1.17%) |
171.40 |
171.40 - 185.00 |
0.1422 times |
Fri 11 July 2025 |
179.39 (5.21%) |
167.01 |
165.10 - 200.00 |
0.6713 times |
Fri 04 July 2025 |
170.50 (-1.7%) |
182.50 |
167.99 - 182.50 |
0.0847 times |
Fri 27 June 2025 |
173.44 (0.33%) |
172.87 |
166.64 - 206.00 |
0.5384 times |
Fri 20 June 2025 |
172.87 (3.51%) |
178.99 |
160.15 - 178.99 |
0.1154 times |
Fri 13 June 2025 |
167.01 (1.43%) |
167.79 |
164.70 - 188.00 |
0.3506 times |
Fri 06 June 2025 |
164.66 (-3.92%) |
171.00 |
158.75 - 174.27 |
0.0868 times |
Fri 30 May 2025 |
171.37 (1.29%) |
172.41 |
155.06 - 175.00 |
0.2771 times |
Fri 23 May 2025 |
169.19 (0.36%) |
177.00 |
162.00 - 177.00 |
0.1166 times |
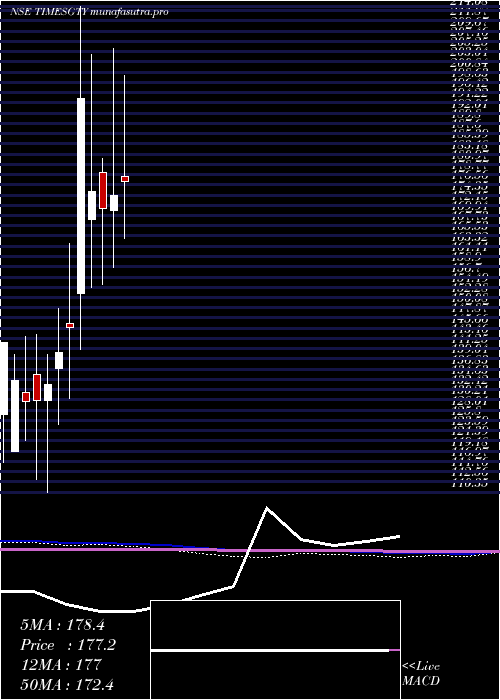
Monthly price and charts TimesGuaranty Strong monthly Stock price targets for TimesGuaranty TIMESGTY are 211.22 and 348.82 | Monthly Target 1 | 104.11 | | Monthly Target 2 | 180.72 | | Monthly Target 3 | 241.71 | | Monthly Target 4 | 318.32 | | Monthly Target 5 | 379.31 |
Monthly price and volumes Times Guaranty
| Date |
Closing |
Open |
Range |
Volume |
Wed 30 July 2025 |
257.33 (47.71%) |
178.25 |
165.10 - 302.70 |
3.8059 times |
Mon 30 June 2025 |
174.21 (1.66%) |
171.00 |
158.75 - 206.00 |
0.4891 times |
Fri 30 May 2025 |
171.37 (-2.16%) |
179.20 |
155.06 - 182.19 |
0.2756 times |
Wed 30 April 2025 |
175.16 (-10.27%) |
168.98 |
154.40 - 204.54 |
0.3196 times |
Tue 24 December 2024 |
195.21 (33.83%) |
153.15 |
141.10 - 214.99 |
1.4796 times |
Fri 29 November 2024 |
145.86 (3.93%) |
146.70 |
130.51 - 163.90 |
0.5364 times |
Thu 31 October 2024 |
140.34 (5.04%) |
137.00 |
124.84 - 149.99 |
0.924 times |
Mon 30 September 2024 |
133.60 (2.7%) |
130.07 |
110.35 - 140.00 |
0.8399 times |
Fri 30 August 2024 |
130.09 (0.22%) |
135.80 |
113.05 - 144.41 |
0.7342 times |
Wed 31 July 2024 |
129.81 (-3.36%) |
131.80 |
121.51 - 143.80 |
0.5958 times |
Fri 28 June 2024 |
134.33 (-5.83%) |
119.01 |
119.00 - 140.00 |
0.5907 times |
DMA SMA EMA moving averages of Times Guaranty TIMESGTY
DMA (daily moving average) of Times Guaranty TIMESGTY
| DMA period | DMA value | | 5 day DMA | 239.71 | | 12 day DMA | 206.41 | | 20 day DMA | 194.85 | | 35 day DMA | 185.45 | | 50 day DMA | 179.81 | | 100 day DMA | 176.04 | | 150 day DMA | 163.21 | | 200 day DMA | 154.9 | EMA (exponential moving average) of Times Guaranty TIMESGTY
| EMA period | EMA current | EMA prev | EMA prev2 | | 5 day EMA | 244.1 | 237.49 | 213.27 | | 12 day EMA | 218.23 | 211.12 | 197.52 | | 20 day EMA | 204.8 | 199.27 | 190.15 | | 35 day EMA | 192.63 | 188.82 | 183.1 | | 50 day EMA | 185.38 | 182.44 | 178.22 |
SMA (simple moving average) of Times Guaranty TIMESGTY
| SMA period | SMA current | SMA prev | SMA prev2 | | 5 day SMA | 239.71 | 225.84 | 206.77 | | 12 day SMA | 206.41 | 199.73 | 190.85 | | 20 day SMA | 194.85 | 190.72 | 184.91 | | 35 day SMA | 185.45 | 183.06 | 179.65 | | 50 day SMA | 179.81 | 178.01 | 175.74 | | 100 day SMA | 176.04 | 174.93 | 173.46 | | 150 day SMA | 163.21 | 162.32 | 161.26 | | 200 day SMA | 154.9 | 154.27 | 153.49 |
|
|
