TijariaPolypipes TIJARIA full analysis,charts,indicators,moving averages,SMA,DMA,EMA,ADX,MACD,RSITijaria Polypipes TIJARIA WideScreen charts, DMA,SMA,EMA technical analysis, forecast prediction, by indicators ADX,MACD,RSI,CCI NSE stock exchange
operates under Plastic Products sector
Daily price and charts and targets TijariaPolypipes Strong Daily Stock price targets for TijariaPolypipes TIJARIA are 6.44 and 7.07 | Daily Target 1 | 5.98 | | Daily Target 2 | 6.26 | | Daily Target 3 | 6.6133333333333 | | Daily Target 4 | 6.89 | | Daily Target 5 | 7.24 |
Daily price and volume Tijaria Polypipes
| Date |
Closing |
Open |
Range |
Volume |
Tue 28 October 2025 |
6.53 (3%) |
6.34 |
6.34 - 6.97 |
1.5498 times |
Mon 27 October 2025 |
6.34 (-0.63%) |
6.34 |
6.30 - 6.45 |
0.4966 times |
Fri 24 October 2025 |
6.38 (1.75%) |
6.12 |
6.12 - 6.48 |
0.2315 times |
Thu 23 October 2025 |
6.27 (-1.57%) |
6.83 |
6.00 - 6.90 |
3.6071 times |
Tue 21 October 2025 |
6.37 (6.17%) |
6.49 |
5.72 - 6.60 |
0.9123 times |
Mon 20 October 2025 |
6.00 (-5.66%) |
6.48 |
5.89 - 6.48 |
1.3598 times |
Fri 17 October 2025 |
6.36 (4.78%) |
6.09 |
5.88 - 6.45 |
0.3992 times |
Thu 16 October 2025 |
6.07 (-0.33%) |
6.10 |
6.01 - 6.21 |
0.1302 times |
Wed 15 October 2025 |
6.09 (-3.49%) |
6.30 |
5.68 - 6.41 |
1.1145 times |
Tue 14 October 2025 |
6.31 (-0.32%) |
6.50 |
6.30 - 6.53 |
0.199 times |
Mon 13 October 2025 |
6.33 (1.77%) |
6.20 |
6.20 - 6.47 |
0.2163 times |
Weekly price and charts TijariaPolypipes Strong weekly Stock price targets for TijariaPolypipes TIJARIA are 6.42 and 7.09 | Weekly Target 1 | 5.93 | | Weekly Target 2 | 6.23 | | Weekly Target 3 | 6.6 | | Weekly Target 4 | 6.9 | | Weekly Target 5 | 7.27 |
Weekly price and volumes for Tijaria Polypipes
| Date |
Closing |
Open |
Range |
Volume |
Tue 28 October 2025 |
6.53 (2.35%) |
6.34 |
6.30 - 6.97 |
0.7701 times |
Fri 24 October 2025 |
6.38 (0.31%) |
6.48 |
5.72 - 6.90 |
2.2996 times |
Fri 17 October 2025 |
6.36 (2.25%) |
6.20 |
5.68 - 6.53 |
0.7749 times |
Fri 10 October 2025 |
6.22 (-0.48%) |
6.44 |
5.67 - 6.69 |
1.0396 times |
Fri 03 October 2025 |
6.25 (3.48%) |
6.29 |
5.86 - 6.47 |
0.2137 times |
Fri 26 September 2025 |
6.04 (-3.51%) |
6.29 |
5.90 - 6.40 |
0.377 times |
Fri 19 September 2025 |
6.26 (-7.26%) |
6.93 |
6.06 - 6.93 |
1.8638 times |
Fri 12 September 2025 |
6.75 (-16.25%) |
6.75 |
6.63 - 7.13 |
0.195 times |
Wed 09 July 2025 |
8.06 (-9.64%) |
8.68 |
8.02 - 8.75 |
0.9495 times |
Fri 04 July 2025 |
8.92 (4.21%) |
8.98 |
8.58 - 10.35 |
1.5169 times |
Fri 27 June 2025 |
8.56 (-25.89%) |
7.07 |
7.07 - 8.57 |
0.7017 times |

Monthly price and charts TijariaPolypipes Strong monthly Stock price targets for TijariaPolypipes TIJARIA are 6.1 and 7.4 | Monthly Target 1 | 5.09 | | Monthly Target 2 | 5.81 | | Monthly Target 3 | 6.39 | | Monthly Target 4 | 7.11 | | Monthly Target 5 | 7.69 |
Monthly price and volumes Tijaria Polypipes
| Date |
Closing |
Open |
Range |
Volume |
Tue 28 October 2025 |
6.53 (5.66%) |
6.45 |
5.67 - 6.97 |
0.2944 times |
Tue 30 September 2025 |
6.18 (-23.33%) |
6.75 |
5.86 - 7.13 |
0.1519 times |
Wed 09 July 2025 |
8.06 (-10.24%) |
9.42 |
8.02 - 10.35 |
0.131 times |
Mon 30 June 2025 |
8.98 (-22.25%) |
7.07 |
7.07 - 8.98 |
0.0567 times |
Fri 01 March 2024 |
11.55 (5%) |
11.55 |
11.55 - 11.55 |
0.0121 times |
Thu 29 February 2024 |
11.00 (77.42%) |
6.40 |
5.75 - 11.00 |
8.2114 times |
Wed 31 January 2024 |
6.20 (-3.13%) |
6.55 |
5.90 - 7.75 |
0.558 times |
Fri 29 December 2023 |
6.40 (0.79%) |
6.65 |
6.05 - 7.15 |
0.2206 times |
Thu 30 November 2023 |
6.35 (3.25%) |
6.35 |
5.75 - 6.70 |
0.0969 times |
Tue 31 October 2023 |
6.15 (-5.38%) |
5.95 |
5.35 - 7.95 |
0.2672 times |
Fri 23 June 2023 |
6.50 (23.81%) |
5.25 |
4.90 - 7.80 |
0.1996 times |

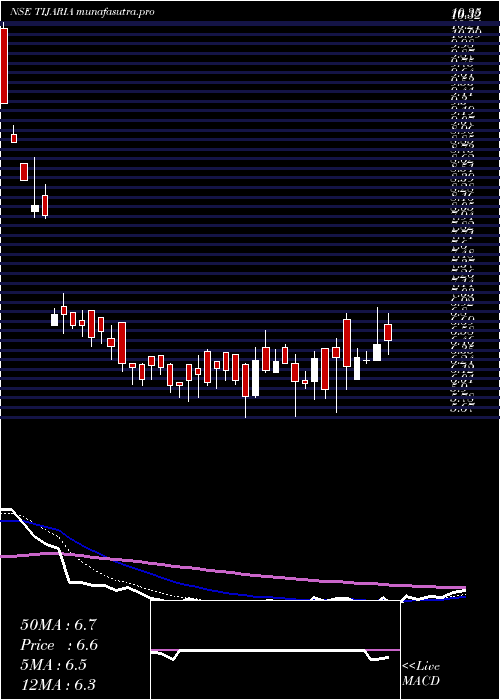
DMA SMA EMA moving averages of Tijaria Polypipes TIJARIA
DMA (daily moving average) of Tijaria Polypipes TIJARIA
| DMA period | DMA value | | 5 day DMA | 6.38 | | 12 day DMA | 6.27 | | 20 day DMA | 6.22 | | 35 day DMA | 6.37 | | 50 day DMA | 7.16 | | 100 day DMA | 6.95 | | 150 day DMA | 6.77 | | 200 day DMA | 6.45 | EMA (exponential moving average) of Tijaria Polypipes TIJARIA
| EMA period | EMA current | EMA prev | EMA prev2 | | 5 day EMA | 6.38 | 6.31 | 6.29 | | 12 day EMA | 6.3 | 6.26 | 6.25 | | 20 day EMA | 6.36 | 6.34 | 6.34 | | 35 day EMA | 6.78 | 6.8 | 6.83 | | 50 day EMA | 7.25 | 7.28 | 7.32 |
SMA (simple moving average) of Tijaria Polypipes TIJARIA
| SMA period | SMA current | SMA prev | SMA prev2 | | 5 day SMA | 6.38 | 6.27 | 6.28 | | 12 day SMA | 6.27 | 6.26 | 6.22 | | 20 day SMA | 6.22 | 6.2 | 6.18 | | 35 day SMA | 6.37 | 6.42 | 6.48 | | 50 day SMA | 7.16 | 7.23 | 7.3 | | 100 day SMA | 6.95 | 6.95 | 6.96 | | 150 day SMA | 6.77 | 6.77 | 6.76 | | 200 day SMA | 6.45 | 6.45 | 6.44 |
|
|
