TechnocraftIndustries TIIL full analysis,charts,indicators,moving averages,SMA,DMA,EMA,ADX,MACD,RSITechnocraft Industries TIIL WideScreen charts, DMA,SMA,EMA technical analysis, forecast prediction, by indicators ADX,MACD,RSI,CCI NSE stock exchange
operates under Iron & Steel Products sector
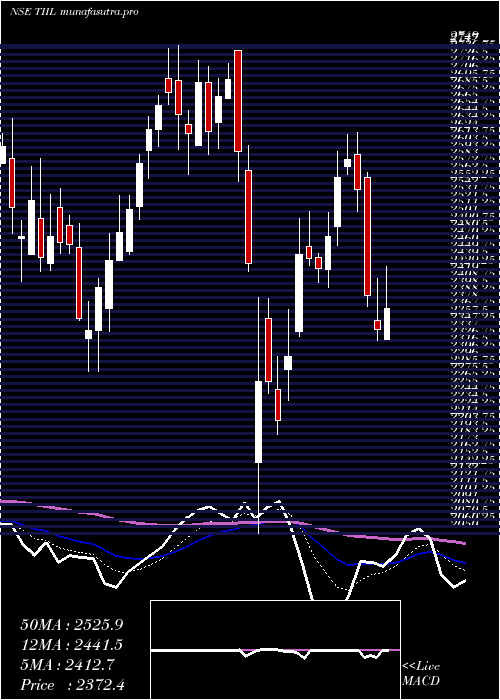
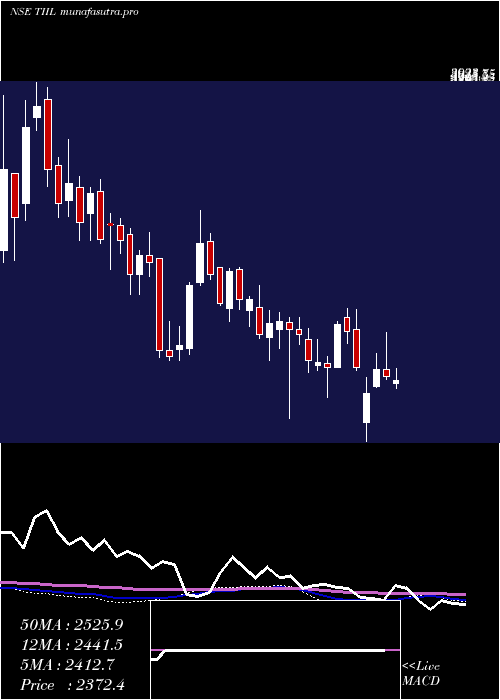
Daily price and charts and targets TechnocraftIndustries Strong Daily Stock price targets for TechnocraftIndustries TIIL are 2375.6 and 2460.9 | Daily Target 1 | 2359.3 | | Daily Target 2 | 2391.9 | | Daily Target 3 | 2444.6 | | Daily Target 4 | 2477.2 | | Daily Target 5 | 2529.9 |
Daily price and volume Technocraft Industries
| Date |
Closing |
Open |
Range |
Volume |
Tue 28 October 2025 |
2424.50 (-2.42%) |
2465.00 |
2412.00 - 2497.30 |
0.7417 times |
Mon 27 October 2025 |
2484.60 (-0.25%) |
2500.80 |
2458.60 - 2515.90 |
0.6732 times |
Fri 24 October 2025 |
2490.80 (-1.59%) |
2531.00 |
2471.10 - 2552.30 |
1.4518 times |
Thu 23 October 2025 |
2531.00 (5.69%) |
2450.00 |
2406.00 - 2545.00 |
2.9863 times |
Tue 21 October 2025 |
2394.80 (0.91%) |
2351.00 |
2351.00 - 2406.30 |
0.4007 times |
Mon 20 October 2025 |
2373.20 (0.44%) |
2369.90 |
2350.10 - 2385.20 |
0.4394 times |
Fri 17 October 2025 |
2362.90 (0.2%) |
2358.10 |
2340.00 - 2389.60 |
0.6374 times |
Thu 16 October 2025 |
2358.10 (3.13%) |
2286.50 |
2286.50 - 2390.00 |
1.2516 times |
Wed 15 October 2025 |
2286.50 (-1.17%) |
2328.40 |
2248.80 - 2328.40 |
0.6218 times |
Tue 14 October 2025 |
2313.50 (-1.08%) |
2335.50 |
2298.60 - 2368.50 |
0.796 times |
Mon 13 October 2025 |
2338.80 (-2.13%) |
2301.30 |
2279.50 - 2351.00 |
2.3619 times |
Weekly price and charts TechnocraftIndustries Strong weekly Stock price targets for TechnocraftIndustries TIIL are 2366.3 and 2470.2 | Weekly Target 1 | 2346.9 | | Weekly Target 2 | 2385.7 | | Weekly Target 3 | 2450.8 | | Weekly Target 4 | 2489.6 | | Weekly Target 5 | 2554.7 |
Weekly price and volumes for Technocraft Industries
| Date |
Closing |
Open |
Range |
Volume |
Tue 28 October 2025 |
2424.50 (-2.66%) |
2500.80 |
2412.00 - 2515.90 |
0.2087 times |
Fri 24 October 2025 |
2490.80 (5.41%) |
2369.90 |
2350.10 - 2552.30 |
0.7785 times |
Fri 17 October 2025 |
2362.90 (-1.13%) |
2301.30 |
2248.80 - 2390.00 |
0.8361 times |
Fri 10 October 2025 |
2389.80 (5.75%) |
2398.00 |
2161.10 - 2449.90 |
1.4429 times |
Fri 03 October 2025 |
2259.80 (-2.8%) |
2358.50 |
2150.50 - 2358.50 |
1.6277 times |
Fri 26 September 2025 |
2325.00 (-7.8%) |
2490.00 |
2308.00 - 2523.90 |
0.5588 times |
Fri 19 September 2025 |
2521.70 (1.53%) |
2475.00 |
2447.10 - 2542.30 |
1.0546 times |
Fri 12 September 2025 |
2483.80 (0.71%) |
2501.50 |
2435.00 - 2597.90 |
1.2399 times |
Fri 05 September 2025 |
2466.30 (-0.03%) |
2450.00 |
2450.00 - 2608.00 |
1.1707 times |
Fri 29 August 2025 |
2467.00 (-10.73%) |
2771.00 |
2456.80 - 2800.00 |
1.082 times |
Fri 22 August 2025 |
2763.50 (3.43%) |
2680.00 |
2641.10 - 2849.90 |
0.5362 times |
Monthly price and charts TechnocraftIndustries Strong monthly Stock price targets for TechnocraftIndustries TIIL are 2292.8 and 2684 | Monthly Target 1 | 1988.1 | | Monthly Target 2 | 2206.3 | | Monthly Target 3 | 2379.3 | | Monthly Target 4 | 2597.5 | | Monthly Target 5 | 2770.5 |
Monthly price and volumes Technocraft Industries
| Date |
Closing |
Open |
Range |
Volume |
Tue 28 October 2025 |
2424.50 (9.93%) |
2200.00 |
2161.10 - 2552.30 |
0.6716 times |
Tue 30 September 2025 |
2205.50 (-10.6%) |
2450.00 |
2150.50 - 2608.00 |
0.983 times |
Fri 29 August 2025 |
2467.00 (-20.93%) |
3130.00 |
2456.80 - 3228.10 |
0.9938 times |
Thu 31 July 2025 |
3120.20 (3.22%) |
3050.00 |
3000.00 - 3383.00 |
1.7526 times |
Mon 30 June 2025 |
3023.00 (-3.08%) |
3140.00 |
2805.00 - 3162.30 |
0.8189 times |
Fri 30 May 2025 |
3119.10 (33.04%) |
2311.00 |
2311.00 - 3250.00 |
1.1441 times |
Wed 30 April 2025 |
2344.40 (-10.72%) |
2639.00 |
2050.00 - 2742.15 |
1.0447 times |
Fri 28 March 2025 |
2625.85 (6.07%) |
2450.05 |
2281.50 - 2749.00 |
0.739 times |
Fri 28 February 2025 |
2475.60 (-7.21%) |
2637.20 |
2174.00 - 2725.00 |
0.6672 times |
Fri 31 January 2025 |
2667.85 (-2.3%) |
2758.90 |
2474.00 - 2965.50 |
1.1852 times |
Tue 31 December 2024 |
2730.60 (6.87%) |
2540.00 |
2505.50 - 3260.00 |
1.2385 times |

DMA SMA EMA moving averages of Technocraft Industries TIIL
DMA (daily moving average) of Technocraft Industries TIIL
| DMA period | DMA value | | 5 day DMA | 2465.14 | | 12 day DMA | 2395.71 | | 20 day DMA | 2330.66 | | 35 day DMA | 2386.23 | | 50 day DMA | 2450.77 | | 100 day DMA | 2772.32 | | 150 day DMA | 2733.06 | | 200 day DMA | 2702.52 | EMA (exponential moving average) of Technocraft Industries TIIL
| EMA period | EMA current | EMA prev | EMA prev2 | | 5 day EMA | 2446.21 | 2457.07 | 2443.3 | | 12 day EMA | 2406.86 | 2403.65 | 2388.94 | | 20 day EMA | 2395.05 | 2391.95 | 2382.2 | | 35 day EMA | 2427.38 | 2427.55 | 2424.19 | | 50 day EMA | 2482.35 | 2484.71 | 2484.71 |
SMA (simple moving average) of Technocraft Industries TIIL
| SMA period | SMA current | SMA prev | SMA prev2 | | 5 day SMA | 2465.14 | 2454.88 | 2430.54 | | 12 day SMA | 2395.71 | 2385.63 | 2363.76 | | 20 day SMA | 2330.66 | 2325.69 | 2320.69 | | 35 day SMA | 2386.23 | 2387.42 | 2387.17 | | 50 day SMA | 2450.77 | 2455.59 | 2458.52 | | 100 day SMA | 2772.32 | 2778.2 | 2783.95 | | 150 day SMA | 2733.06 | 2734.11 | 2734.3 | | 200 day SMA | 2702.52 | 2704.98 | 2707.27 |
|
|
