TilaknagarIndustries TI full analysis,charts,indicators,moving averages,SMA,DMA,EMA,ADX,MACD,RSITilaknagar Industries TI WideScreen charts, DMA,SMA,EMA technical analysis, forecast prediction, by indicators ADX,MACD,RSI,CCI NSE stock exchange
operates under Breweries & Distilleries sector
Daily price and charts and targets TilaknagarIndustries Strong Daily Stock price targets for TilaknagarIndustries TI are 484.25 and 510.3 | Daily Target 1 | 463.27 | | Daily Target 2 | 479.18 | | Daily Target 3 | 489.31666666667 | | Daily Target 4 | 505.23 | | Daily Target 5 | 515.37 |
Daily price and volume Tilaknagar Industries
| Date |
Closing |
Open |
Range |
Volume |
Tue 28 October 2025 |
495.10 (4.11%) |
473.40 |
473.40 - 499.45 |
2.0065 times |
Mon 27 October 2025 |
475.55 (0.49%) |
472.00 |
472.00 - 480.35 |
0.3499 times |
Fri 24 October 2025 |
473.25 (-1.6%) |
481.10 |
467.00 - 483.35 |
0.5126 times |
Thu 23 October 2025 |
480.95 (-2.6%) |
496.25 |
477.00 - 497.85 |
0.7149 times |
Tue 21 October 2025 |
493.80 (1.19%) |
490.35 |
490.10 - 499.90 |
0.7333 times |
Mon 20 October 2025 |
488.00 (3.76%) |
472.25 |
466.80 - 492.30 |
2.0381 times |
Fri 17 October 2025 |
470.30 (-0.95%) |
474.80 |
465.10 - 476.90 |
0.3587 times |
Thu 16 October 2025 |
474.80 (-0.38%) |
478.90 |
472.00 - 480.00 |
0.5202 times |
Wed 15 October 2025 |
476.60 (4.55%) |
456.80 |
452.20 - 482.00 |
2.0785 times |
Tue 14 October 2025 |
455.85 (0.61%) |
454.90 |
440.10 - 465.00 |
0.6873 times |
Mon 13 October 2025 |
453.10 (-0.03%) |
448.00 |
447.90 - 455.90 |
0.244 times |
Weekly price and charts TilaknagarIndustries Strong weekly Stock price targets for TilaknagarIndustries TI are 483.55 and 511 | Weekly Target 1 | 461.4 | | Weekly Target 2 | 478.25 | | Weekly Target 3 | 488.85 | | Weekly Target 4 | 505.7 | | Weekly Target 5 | 516.3 |
Weekly price and volumes for Tilaknagar Industries
| Date |
Closing |
Open |
Range |
Volume |
Tue 28 October 2025 |
495.10 (4.62%) |
472.00 |
472.00 - 499.45 |
0.6754 times |
Fri 24 October 2025 |
473.25 (0.63%) |
472.25 |
466.80 - 499.90 |
1.1462 times |
Fri 17 October 2025 |
470.30 (3.76%) |
448.00 |
440.10 - 482.00 |
1.1146 times |
Fri 10 October 2025 |
453.25 (-3.41%) |
473.95 |
452.05 - 477.95 |
0.6946 times |
Fri 03 October 2025 |
469.25 (6.05%) |
444.40 |
435.95 - 470.00 |
0.7109 times |
Fri 26 September 2025 |
442.50 (-3.66%) |
459.00 |
440.00 - 472.00 |
0.856 times |
Fri 19 September 2025 |
459.30 (-2.13%) |
469.65 |
457.10 - 486.90 |
1.8592 times |
Fri 12 September 2025 |
469.30 (2.15%) |
461.20 |
451.25 - 482.00 |
1.1538 times |
Fri 05 September 2025 |
459.40 (-3.04%) |
474.90 |
455.60 - 488.00 |
1.037 times |
Fri 29 August 2025 |
473.80 (-3.16%) |
491.00 |
468.55 - 491.25 |
0.7524 times |
Fri 22 August 2025 |
489.25 (-2.84%) |
509.00 |
478.75 - 529.90 |
2.4993 times |
Monthly price and charts TilaknagarIndustries Strong monthly Stock price targets for TilaknagarIndustries TI are 467.6 and 527.4 | Monthly Target 1 | 418.57 | | Monthly Target 2 | 456.83 | | Monthly Target 3 | 478.36666666667 | | Monthly Target 4 | 516.63 | | Monthly Target 5 | 538.17 |
Monthly price and volumes Tilaknagar Industries
| Date |
Closing |
Open |
Range |
Volume |
Tue 28 October 2025 |
495.10 (10.38%) |
446.20 |
440.10 - 499.90 |
0.4348 times |
Tue 30 September 2025 |
448.55 (-5.33%) |
474.90 |
435.95 - 488.00 |
0.56 times |
Fri 29 August 2025 |
473.80 (-3.74%) |
493.40 |
464.90 - 529.90 |
0.9028 times |
Thu 31 July 2025 |
492.20 (41.86%) |
347.90 |
337.00 - 524.00 |
3.3641 times |
Mon 30 June 2025 |
346.95 (-6.6%) |
372.75 |
341.10 - 391.00 |
0.8717 times |
Fri 30 May 2025 |
371.45 (29.6%) |
284.00 |
270.00 - 376.80 |
0.9704 times |
Wed 30 April 2025 |
286.62 (21.06%) |
236.70 |
199.53 - 313.50 |
0.7648 times |
Fri 28 March 2025 |
236.75 (6.79%) |
221.53 |
211.10 - 265.99 |
0.5849 times |
Fri 28 February 2025 |
221.70 (-39.67%) |
384.00 |
213.40 - 412.95 |
0.8476 times |
Fri 31 January 2025 |
367.50 (-12.97%) |
422.40 |
328.30 - 457.00 |
0.699 times |
Tue 31 December 2024 |
422.25 (3.24%) |
408.55 |
389.30 - 444.20 |
0.5147 times |

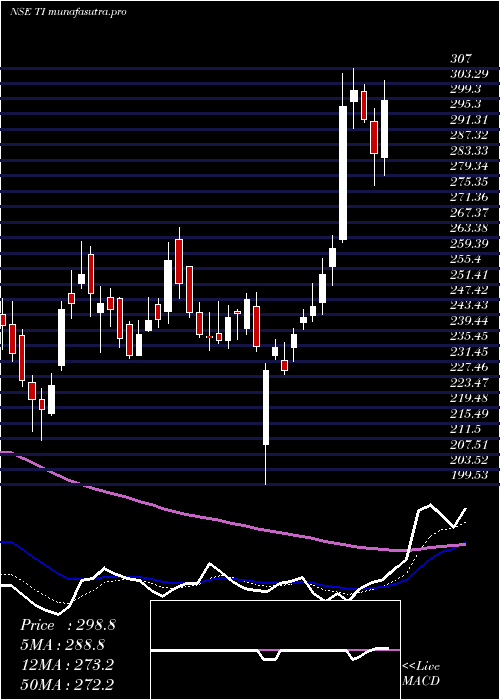
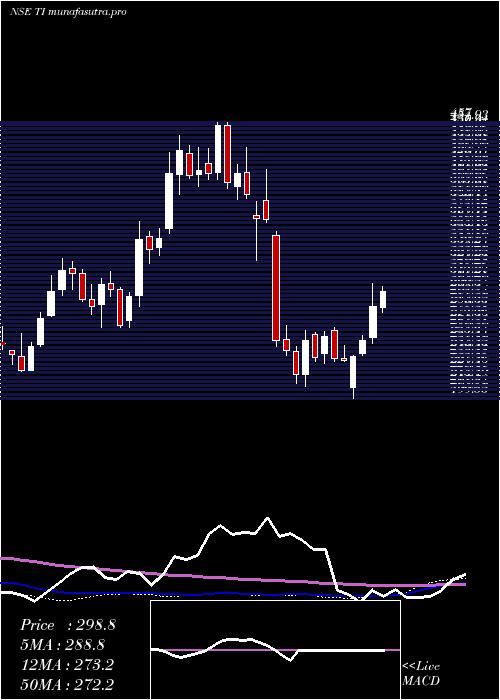
DMA SMA EMA moving averages of Tilaknagar Industries TI
DMA (daily moving average) of Tilaknagar Industries TI
| DMA period | DMA value | | 5 day DMA | 483.73 | | 12 day DMA | 474.21 | | 20 day DMA | 468.83 | | 35 day DMA | 466.86 | | 50 day DMA | 472.3 | | 100 day DMA | 438.42 | | 150 day DMA | 389.8 | | 200 day DMA | 371.76 | EMA (exponential moving average) of Tilaknagar Industries TI
| EMA period | EMA current | EMA prev | EMA prev2 | | 5 day EMA | 483.37 | 477.51 | 478.49 | | 12 day EMA | 477.13 | 473.86 | 473.55 | | 20 day EMA | 473.57 | 471.3 | 470.85 | | 35 day EMA | 473.45 | 472.18 | 471.98 | | 50 day EMA | 474.43 | 473.59 | 473.51 |
SMA (simple moving average) of Tilaknagar Industries TI
| SMA period | SMA current | SMA prev | SMA prev2 | | 5 day SMA | 483.73 | 482.31 | 481.26 | | 12 day SMA | 474.21 | 471.17 | 470.59 | | 20 day SMA | 468.83 | 466.2 | 465.29 | | 35 day SMA | 466.86 | 465.84 | 465.39 | | 50 day SMA | 472.3 | 472.49 | 472.85 | | 100 day SMA | 438.42 | 437.08 | 435.9 | | 150 day SMA | 389.8 | 388.11 | 386.53 | | 200 day SMA | 371.76 | 371.38 | 371.28 |
|
|
