ThyrocareTech THYROCARE full analysis,charts,indicators,moving averages,SMA,DMA,EMA,ADX,MACD,RSIThyrocare Tech THYROCARE WideScreen charts, DMA,SMA,EMA technical analysis, forecast prediction, by indicators ADX,MACD,RSI,CCI NSE stock exchange
Daily price and charts and targets ThyrocareTech Strong Daily Stock price targets for ThyrocareTech THYROCARE are 1329.2 and 1378.4 | Daily Target 1 | 1289.27 | | Daily Target 2 | 1319.93 | | Daily Target 3 | 1338.4666666667 | | Daily Target 4 | 1369.13 | | Daily Target 5 | 1387.67 |
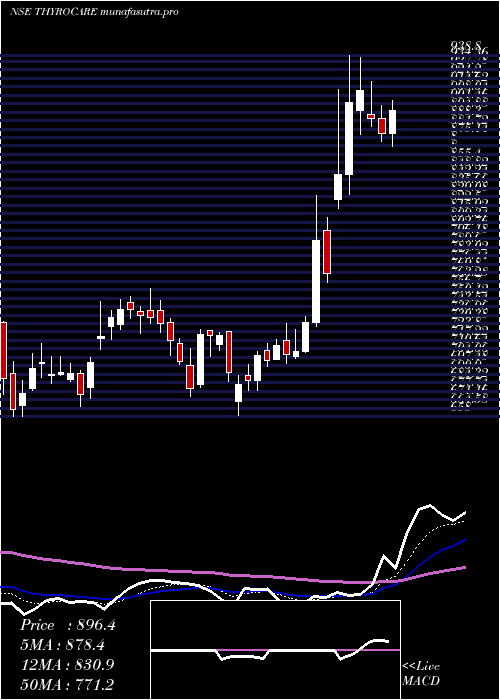
Daily price and volume Thyrocare Tech
| Date |
Closing |
Open |
Range |
Volume |
Wed 29 October 2025 |
1350.60 (1.53%) |
1331.60 |
1307.80 - 1357.00 |
0.1767 times |
Tue 28 October 2025 |
1330.30 (3.15%) |
1289.10 |
1269.00 - 1333.90 |
0.2982 times |
Mon 27 October 2025 |
1289.70 (1.86%) |
1287.00 |
1275.00 - 1298.00 |
0.3155 times |
Fri 24 October 2025 |
1266.10 (1.13%) |
1262.00 |
1252.00 - 1279.00 |
4.2702 times |
Thu 23 October 2025 |
1251.90 (-0.43%) |
1274.60 |
1245.30 - 1274.60 |
0.1072 times |
Tue 21 October 2025 |
1257.30 (1.21%) |
1252.50 |
1246.40 - 1262.30 |
0.0349 times |
Mon 20 October 2025 |
1242.30 (-0.13%) |
1254.40 |
1236.50 - 1271.90 |
0.1138 times |
Fri 17 October 2025 |
1243.90 (-2.49%) |
1281.00 |
1240.00 - 1281.00 |
0.1741 times |
Thu 16 October 2025 |
1275.70 (2.99%) |
1250.00 |
1250.00 - 1308.80 |
0.8491 times |
Wed 15 October 2025 |
1238.70 (-2.05%) |
1450.00 |
1206.00 - 1474.00 |
3.6601 times |
Tue 14 October 2025 |
1264.60 (0.24%) |
1280.00 |
1253.00 - 1310.00 |
0.0894 times |
Weekly price and charts ThyrocareTech Strong weekly Stock price targets for ThyrocareTech THYROCARE are 1309.8 and 1397.8 | Weekly Target 1 | 1237.53 | | Weekly Target 2 | 1294.07 | | Weekly Target 3 | 1325.5333333333 | | Weekly Target 4 | 1382.07 | | Weekly Target 5 | 1413.53 |
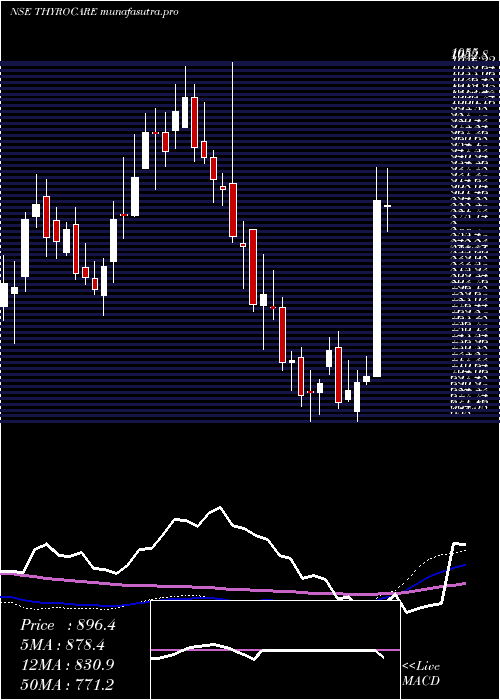
Weekly price and volumes for Thyrocare Tech
| Date |
Closing |
Open |
Range |
Volume |
Wed 29 October 2025 |
1350.60 (6.67%) |
1287.00 |
1269.00 - 1357.00 |
0.64 times |
Fri 24 October 2025 |
1266.10 (1.78%) |
1254.40 |
1236.50 - 1279.00 |
3.6649 times |
Fri 17 October 2025 |
1243.90 (-1.59%) |
1264.00 |
1206.00 - 1474.00 |
3.9472 times |
Fri 10 October 2025 |
1264.00 (7.25%) |
1178.90 |
1172.00 - 1270.50 |
0.185 times |
Fri 03 October 2025 |
1178.50 (4.83%) |
1124.00 |
1091.20 - 1237.00 |
0.2494 times |
Fri 26 September 2025 |
1124.20 (-6.78%) |
1205.90 |
1112.50 - 1242.50 |
0.1514 times |
Fri 19 September 2025 |
1205.90 (-1.45%) |
1230.00 |
1181.00 - 1233.60 |
0.1984 times |
Fri 12 September 2025 |
1223.70 (-7.78%) |
1330.90 |
1216.10 - 1383.60 |
0.2866 times |
Fri 05 September 2025 |
1326.90 (4.87%) |
1255.00 |
1255.00 - 1373.10 |
0.4587 times |
Fri 29 August 2025 |
1265.30 (-0.5%) |
1266.00 |
1247.30 - 1329.70 |
0.2185 times |
Fri 22 August 2025 |
1271.70 (-8.09%) |
1408.00 |
1256.00 - 1423.40 |
0.2512 times |
Monthly price and charts ThyrocareTech Strong monthly Stock price targets for ThyrocareTech THYROCARE are 1240.3 and 1584.3 | Monthly Target 1 | 974.2 | | Monthly Target 2 | 1162.4 | | Monthly Target 3 | 1318.2 | | Monthly Target 4 | 1506.4 | | Monthly Target 5 | 1662.2 |
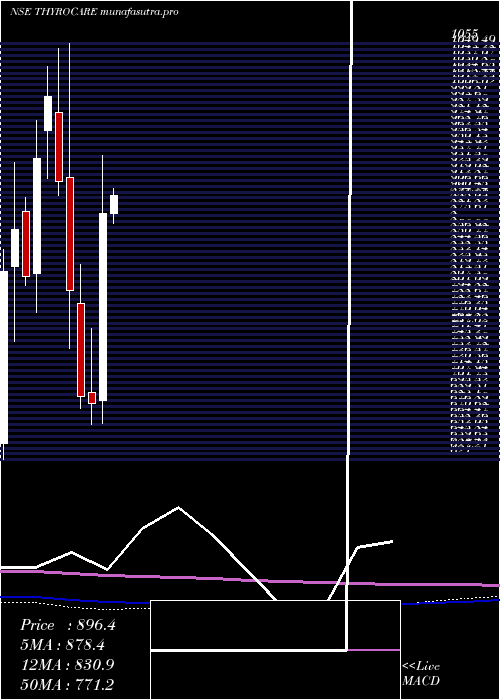
Monthly price and volumes Thyrocare Tech
| Date |
Closing |
Open |
Range |
Volume |
Wed 29 October 2025 |
1350.60 (16.37%) |
1159.90 |
1130.00 - 1474.00 |
4.5469 times |
Tue 30 September 2025 |
1160.60 (-8.27%) |
1255.00 |
1091.20 - 1383.60 |
0.6854 times |
Fri 29 August 2025 |
1265.30 (-4.57%) |
1331.00 |
1247.30 - 1435.00 |
0.5894 times |
Thu 31 July 2025 |
1325.90 (33.86%) |
986.00 |
969.05 - 1357.85 |
1.1521 times |
Mon 30 June 2025 |
990.50 (-5.59%) |
1060.00 |
874.10 - 1073.20 |
0.2784 times |
Fri 30 May 2025 |
1049.20 (19.49%) |
878.10 |
868.00 - 1053.60 |
0.4863 times |
Wed 30 April 2025 |
878.10 (29.2%) |
682.70 |
658.70 - 938.80 |
1.2204 times |
Fri 28 March 2025 |
679.65 (-1.15%) |
691.20 |
658.00 - 757.75 |
0.1848 times |
Fri 28 February 2025 |
687.55 (-13.87%) |
784.00 |
675.00 - 824.95 |
0.1425 times |
Fri 31 January 2025 |
798.25 (-12.45%) |
916.00 |
737.55 - 1055.00 |
0.7139 times |
Tue 31 December 2024 |
911.80 (-8.85%) |
983.00 |
897.05 - 1050.15 |
0.2176 times |
DMA SMA EMA moving averages of Thyrocare Tech THYROCARE
DMA (daily moving average) of Thyrocare Tech THYROCARE
| DMA period | DMA value | | 5 day DMA | 1297.72 | | 12 day DMA | 1272.73 | | 20 day DMA | 1244.54 | | 35 day DMA | 1230.81 | | 50 day DMA | 1256.09 | | 100 day DMA | 1198.02 | | 150 day DMA | 1086.34 | | 200 day DMA | 1005.16 | EMA (exponential moving average) of Thyrocare Tech THYROCARE
| EMA period | EMA current | EMA prev | EMA prev2 | | 5 day EMA | 1309.12 | 1288.39 | 1267.44 | | 12 day EMA | 1277.83 | 1264.6 | 1252.66 | | 20 day EMA | 1262.35 | 1253.06 | 1244.93 | | 35 day EMA | 1264.23 | 1259.15 | 1254.96 | | 50 day EMA | 1268.74 | 1265.4 | 1262.75 |
SMA (simple moving average) of Thyrocare Tech THYROCARE
| SMA period | SMA current | SMA prev | SMA prev2 | | 5 day SMA | 1297.72 | 1279.06 | 1261.46 | | 12 day SMA | 1272.73 | 1265.51 | 1255.2 | | 20 day SMA | 1244.54 | 1235.81 | 1225.5 | | 35 day SMA | 1230.81 | 1229.99 | 1229.89 | | 50 day SMA | 1256.09 | 1256.75 | 1257.67 | | 100 day SMA | 1198.02 | 1194.48 | 1191.17 | | 150 day SMA | 1086.34 | 1082.28 | 1078.35 | | 200 day SMA | 1005.16 | 1003.17 | 1001.61 |
|
|
