ThomasScott THOMASCOTT full analysis,charts,indicators,moving averages,SMA,DMA,EMA,ADX,MACD,RSIThomas Scott THOMASCOTT WideScreen charts, DMA,SMA,EMA technical analysis, forecast prediction, by indicators ADX,MACD,RSI,CCI NSE stock exchange
operates under Other Apparels & Accessories sector
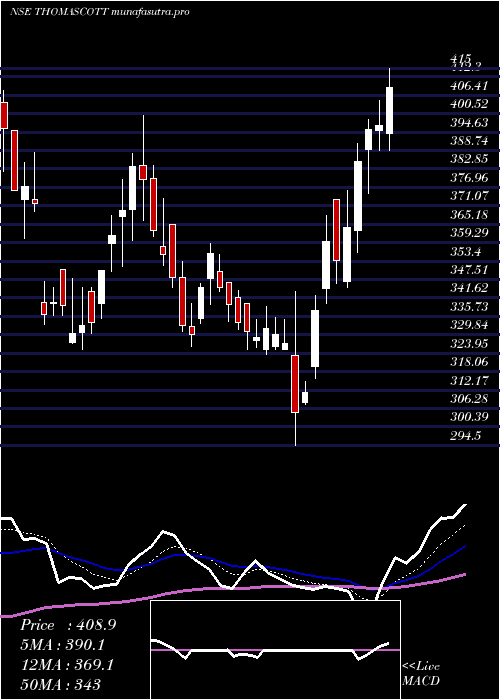
Daily price and charts and targets ThomasScott Strong Daily Stock price targets for ThomasScott THOMASCOTT are 398.73 and 425.13 | Daily Target 1 | 377.75 | | Daily Target 2 | 393.3 | | Daily Target 3 | 404.15 | | Daily Target 4 | 419.7 | | Daily Target 5 | 430.55 |
Daily price and volume Thomas Scott
| Date |
Closing |
Open |
Range |
Volume |
Thu 30 October 2025 |
408.85 (3.06%) |
394.05 |
388.60 - 415.00 |
0.9048 times |
Wed 29 October 2025 |
396.70 (0.32%) |
395.00 |
388.75 - 404.80 |
0.7747 times |
Tue 28 October 2025 |
395.45 (2.62%) |
389.00 |
375.00 - 398.80 |
1.0223 times |
Mon 27 October 2025 |
385.35 (5.85%) |
363.20 |
356.15 - 391.00 |
1.404 times |
Fri 24 October 2025 |
364.05 (2.96%) |
347.00 |
345.05 - 376.00 |
0.6646 times |
Thu 23 October 2025 |
353.60 (-1.7%) |
372.95 |
346.10 - 372.95 |
0.9592 times |
Tue 21 October 2025 |
359.70 (6.58%) |
344.70 |
340.00 - 368.00 |
0.908 times |
Mon 20 October 2025 |
337.50 (8.4%) |
319.85 |
315.85 - 342.45 |
1.1191 times |
Fri 17 October 2025 |
311.35 (2.07%) |
308.15 |
307.70 - 315.00 |
0.1812 times |
Thu 16 October 2025 |
305.05 (-6.76%) |
323.20 |
294.50 - 343.70 |
2.062 times |
Wed 15 October 2025 |
327.15 (-0.85%) |
325.10 |
325.00 - 334.80 |
0.285 times |
Weekly price and charts ThomasScott Strong weekly Stock price targets for ThomasScott THOMASCOTT are 382.5 and 441.35 | Weekly Target 1 | 334.48 | | Weekly Target 2 | 371.67 | | Weekly Target 3 | 393.33333333333 | | Weekly Target 4 | 430.52 | | Weekly Target 5 | 452.18 |
Weekly price and volumes for Thomas Scott
| Date |
Closing |
Open |
Range |
Volume |
Thu 30 October 2025 |
408.85 (12.31%) |
363.20 |
356.15 - 415.00 |
1.4588 times |
Fri 24 October 2025 |
364.05 (16.93%) |
319.85 |
315.85 - 376.00 |
1.2972 times |
Fri 17 October 2025 |
311.35 (-5.36%) |
325.20 |
294.50 - 343.70 |
1.0096 times |
Fri 10 October 2025 |
329.00 (-7.55%) |
350.10 |
325.20 - 355.65 |
0.2998 times |
Fri 03 October 2025 |
355.85 (2.18%) |
348.25 |
326.10 - 359.00 |
0.3866 times |
Fri 26 September 2025 |
348.25 (-5.75%) |
369.95 |
345.00 - 399.85 |
0.9956 times |
Fri 19 September 2025 |
369.50 (11.83%) |
330.45 |
325.00 - 379.60 |
1.0493 times |
Fri 12 September 2025 |
330.40 (-11.17%) |
340.05 |
327.00 - 350.80 |
0.3381 times |
Wed 09 July 2025 |
371.95 (-5.99%) |
395.00 |
360.65 - 395.10 |
0.7591 times |
Fri 04 July 2025 |
395.65 (-1.9%) |
409.75 |
357.00 - 409.75 |
2.406 times |
Fri 27 June 2025 |
403.30 (35.27%) |
296.65 |
292.40 - 403.30 |
3.3248 times |

Monthly price and charts ThomasScott Strong monthly Stock price targets for ThomasScott THOMASCOTT are 351.68 and 472.18 | Monthly Target 1 | 252.28 | | Monthly Target 2 | 330.57 | | Monthly Target 3 | 372.78333333333 | | Monthly Target 4 | 451.07 | | Monthly Target 5 | 493.28 |
Monthly price and volumes Thomas Scott
| Date |
Closing |
Open |
Range |
Volume |
Thu 30 October 2025 |
408.85 (23.95%) |
335.00 |
294.50 - 415.00 |
1.365 times |
Tue 30 September 2025 |
329.85 (-11.32%) |
340.05 |
325.00 - 399.85 |
0.8462 times |
Wed 09 July 2025 |
371.95 (-2.92%) |
364.00 |
357.00 - 408.00 |
0.8457 times |
Mon 30 June 2025 |
383.15 (22.39%) |
297.40 |
287.50 - 409.75 |
2.1921 times |
Fri 30 May 2025 |
313.05 (-16.34%) |
354.90 |
313.05 - 358.00 |
0.152 times |
Mon 16 December 2024 |
374.20 (70.61%) |
230.29 |
220.81 - 374.20 |
1.7352 times |
Fri 29 November 2024 |
219.33 (4.84%) |
218.00 |
185.59 - 227.00 |
1.4644 times |
Thu 31 October 2024 |
209.21 (358.79%) |
241.25 |
202.10 - 271.14 |
1.3502 times |
Thu 13 April 2023 |
45.60 (23.58%) |
36.20 |
35.25 - 47.95 |
0.0256 times |
Fri 31 March 2023 |
36.90 (-18.99%) |
45.55 |
32.35 - 45.55 |
0.0237 times |
Tue 28 February 2023 |
45.55 (335.89%) |
42.00 |
39.45 - 45.80 |
0.0137 times |

DMA SMA EMA moving averages of Thomas Scott THOMASCOTT
DMA (daily moving average) of Thomas Scott THOMASCOTT
| DMA period | DMA value | | 5 day DMA | 390.08 | | 12 day DMA | 356.23 | | 20 day DMA | 349.25 | | 35 day DMA | 349.61 | | 50 day DMA | 352.46 | | 100 day DMA | 311.91 | | 150 day DMA | 244.03 | | 200 day DMA | 186.44 | EMA (exponential moving average) of Thomas Scott THOMASCOTT
| EMA period | EMA current | EMA prev | EMA prev2 | | 5 day EMA | 390.12 | 380.75 | 372.77 | | 12 day EMA | 369.1 | 361.88 | 355.55 | | 20 day EMA | 359.6 | 354.42 | 349.97 | | 35 day EMA | 352.91 | 349.62 | 346.85 | | 50 day EMA | 352.11 | 349.79 | 347.88 |
SMA (simple moving average) of Thomas Scott THOMASCOTT
| SMA period | SMA current | SMA prev | SMA prev2 | | 5 day SMA | 390.08 | 379.03 | 371.63 | | 12 day SMA | 356.23 | 349.8 | 344.16 | | 20 day SMA | 349.25 | 345.3 | 342.11 | | 35 day SMA | 349.61 | 347.54 | 346.83 | | 50 day SMA | 352.46 | 350.11 | 348.16 | | 100 day SMA | 311.91 | 309.97 | 308.12 | | 150 day SMA | 244.03 | 241.58 | 239.01 | | 200 day SMA | 186.44 | 184.48 | 182.58 |
|
|
