ThomasCook THOMASCOOK full analysis,charts,indicators,moving averages,SMA,DMA,EMA,ADX,MACD,RSIThomas Cook THOMASCOOK WideScreen charts, DMA,SMA,EMA technical analysis, forecast prediction, by indicators ADX,MACD,RSI,CCI NSE stock exchange
operates under Travel Support Services sector
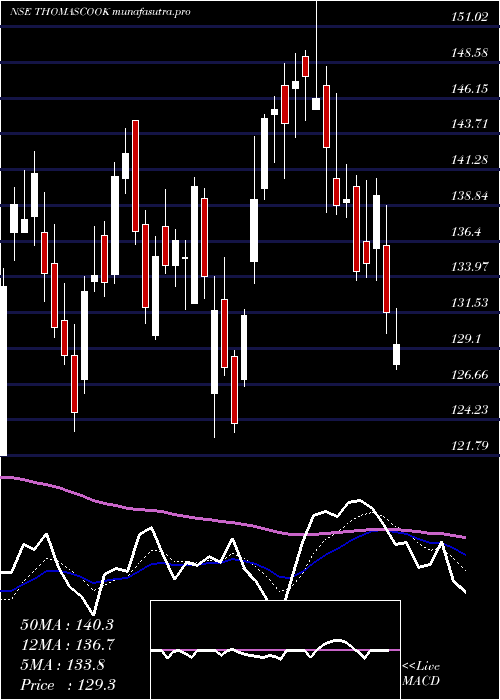
Daily price and charts and targets ThomasCook Strong Daily Stock price targets for ThomasCook THOMASCOOK are 159.91 and 164.11 | Daily Target 1 | 159.07 | | Daily Target 2 | 160.75 | | Daily Target 3 | 163.27333333333 | | Daily Target 4 | 164.95 | | Daily Target 5 | 167.47 |
Daily price and volume Thomas Cook
| Date |
Closing |
Open |
Range |
Volume |
Tue 28 October 2025 |
162.42 (-1.84%) |
165.80 |
161.60 - 165.80 |
0.5217 times |
Mon 27 October 2025 |
165.47 (0.91%) |
163.97 |
163.26 - 166.50 |
0.7038 times |
Fri 24 October 2025 |
163.97 (-0.19%) |
163.50 |
162.06 - 165.00 |
0.5929 times |
Thu 23 October 2025 |
164.28 (-1.84%) |
168.53 |
162.16 - 168.73 |
0.8799 times |
Tue 21 October 2025 |
167.36 (0.17%) |
164.56 |
163.40 - 169.00 |
0.3848 times |
Mon 20 October 2025 |
167.07 (2.8%) |
163.85 |
162.36 - 168.10 |
0.9859 times |
Fri 17 October 2025 |
162.52 (-1.97%) |
165.25 |
161.10 - 165.80 |
0.3758 times |
Thu 16 October 2025 |
165.78 (1.2%) |
163.82 |
163.40 - 167.93 |
1.5322 times |
Wed 15 October 2025 |
163.82 (-0.41%) |
164.50 |
162.00 - 166.50 |
1.1199 times |
Tue 14 October 2025 |
164.49 (2.43%) |
161.00 |
159.69 - 165.19 |
2.9029 times |
Mon 13 October 2025 |
160.58 (5.15%) |
153.90 |
151.39 - 161.80 |
3.8186 times |
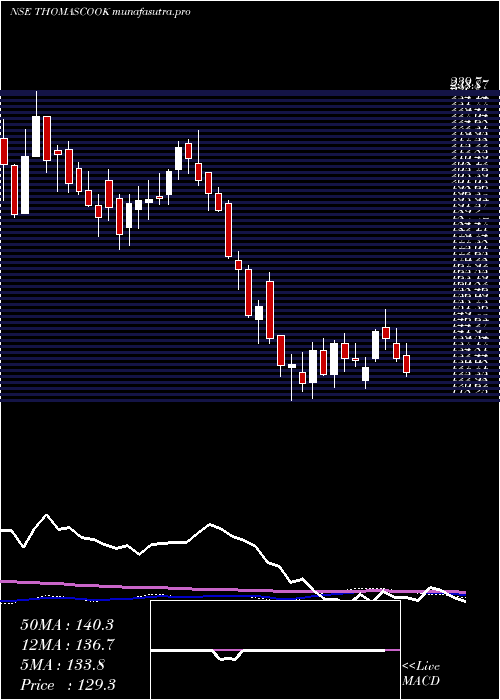
Weekly price and charts ThomasCook Strong weekly Stock price targets for ThomasCook THOMASCOOK are 159.56 and 164.46 | Weekly Target 1 | 158.61 | | Weekly Target 2 | 160.51 | | Weekly Target 3 | 163.50666666667 | | Weekly Target 4 | 165.41 | | Weekly Target 5 | 168.41 |
Weekly price and volumes for Thomas Cook
| Date |
Closing |
Open |
Range |
Volume |
Tue 28 October 2025 |
162.42 (-0.95%) |
163.97 |
161.60 - 166.50 |
0.2111 times |
Fri 24 October 2025 |
163.97 (0.89%) |
163.85 |
162.06 - 169.00 |
0.4898 times |
Fri 17 October 2025 |
162.52 (6.42%) |
153.90 |
151.39 - 167.93 |
1.6795 times |
Fri 10 October 2025 |
152.72 (-4.27%) |
159.64 |
150.37 - 160.41 |
1.5145 times |
Fri 03 October 2025 |
159.53 (-1.97%) |
163.90 |
156.10 - 164.27 |
0.7046 times |
Fri 26 September 2025 |
162.73 (-5.49%) |
172.00 |
161.10 - 173.36 |
0.8842 times |
Fri 19 September 2025 |
172.18 (-0.43%) |
173.87 |
166.25 - 175.00 |
1.1698 times |
Fri 12 September 2025 |
172.92 (-3.42%) |
179.50 |
172.12 - 181.41 |
0.9132 times |
Fri 05 September 2025 |
179.04 (0.74%) |
179.50 |
171.00 - 181.55 |
1.0912 times |
Fri 29 August 2025 |
177.73 (3.25%) |
173.87 |
172.70 - 180.50 |
1.3421 times |
Fri 22 August 2025 |
172.13 (8.58%) |
159.53 |
153.61 - 175.80 |
2.6056 times |
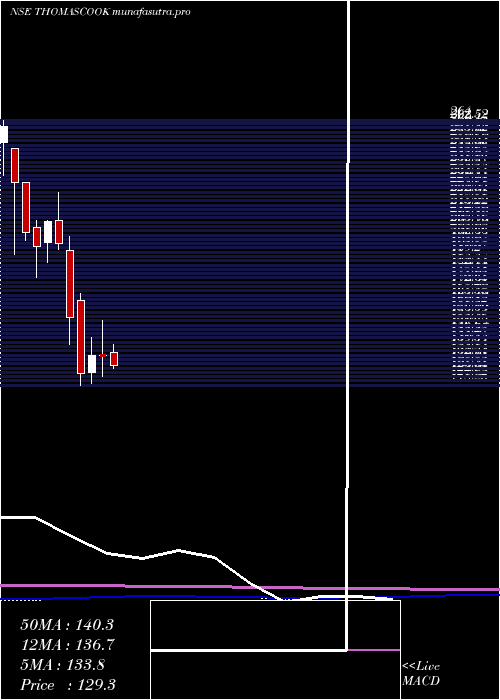
Monthly price and charts ThomasCook Strong monthly Stock price targets for ThomasCook THOMASCOOK are 156.4 and 175.03 | Monthly Target 1 | 141.97 | | Monthly Target 2 | 152.19 | | Monthly Target 3 | 160.59666666667 | | Monthly Target 4 | 170.82 | | Monthly Target 5 | 179.23 |
Monthly price and volumes Thomas Cook
| Date |
Closing |
Open |
Range |
Volume |
Tue 28 October 2025 |
162.42 (2.67%) |
157.95 |
150.37 - 169.00 |
0.6257 times |
Tue 30 September 2025 |
158.19 (-10.99%) |
179.50 |
156.10 - 181.55 |
0.6743 times |
Fri 29 August 2025 |
177.73 (4.95%) |
168.91 |
144.74 - 180.50 |
1.0036 times |
Thu 31 July 2025 |
169.34 (3.55%) |
163.60 |
155.36 - 188.29 |
2.101 times |
Mon 30 June 2025 |
163.53 (-5.27%) |
173.99 |
152.75 - 179.05 |
0.9372 times |
Fri 30 May 2025 |
172.62 (28.49%) |
136.40 |
125.50 - 173.90 |
1.4899 times |
Wed 30 April 2025 |
134.34 (-0.27%) |
134.71 |
123.01 - 154.05 |
0.6632 times |
Fri 28 March 2025 |
134.71 (7.85%) |
125.49 |
119.20 - 144.64 |
0.7643 times |
Fri 28 February 2025 |
124.90 (-19.6%) |
165.00 |
118.25 - 168.60 |
1.1367 times |
Fri 31 January 2025 |
155.35 (-20.9%) |
192.74 |
140.83 - 200.00 |
0.6042 times |
Tue 31 December 2024 |
196.39 (-5.79%) |
209.00 |
193.00 - 224.50 |
0.4443 times |
DMA SMA EMA moving averages of Thomas Cook THOMASCOOK
DMA (daily moving average) of Thomas Cook THOMASCOOK
| DMA period | DMA value | | 5 day DMA | 164.7 | | 12 day DMA | 163.37 | | 20 day DMA | 160.71 | | 35 day DMA | 165.34 | | 50 day DMA | 167.66 | | 100 day DMA | 166.3 | | 150 day DMA | 159.12 | | 200 day DMA | 155.67 | EMA (exponential moving average) of Thomas Cook THOMASCOOK
| EMA period | EMA current | EMA prev | EMA prev2 | | 5 day EMA | 164.04 | 164.85 | 164.54 | | 12 day EMA | 163.45 | 163.64 | 163.31 | | 20 day EMA | 163.38 | 163.48 | 163.27 | | 35 day EMA | 164.34 | 164.45 | 164.39 | | 50 day EMA | 166.34 | 166.5 | 166.54 |
SMA (simple moving average) of Thomas Cook THOMASCOOK
| SMA period | SMA current | SMA prev | SMA prev2 | | 5 day SMA | 164.7 | 165.63 | 165.04 | | 12 day SMA | 163.37 | 162.45 | 161.58 | | 20 day SMA | 160.71 | 160.73 | 160.79 | | 35 day SMA | 165.34 | 165.82 | 166.18 | | 50 day SMA | 167.66 | 167.57 | 167.41 | | 100 day SMA | 166.3 | 166.43 | 166.5 | | 150 day SMA | 159.12 | 158.93 | 158.71 | | 200 day SMA | 155.67 | 155.78 | 155.92 |
|
|
