TranswarrantyFinance TFL full analysis,charts,indicators,moving averages,SMA,DMA,EMA,ADX,MACD,RSITranswarranty Finance TFL WideScreen charts, DMA,SMA,EMA technical analysis, forecast prediction, by indicators ADX,MACD,RSI,CCI NSE stock exchange
operates under Finance (including NBFCs) sector
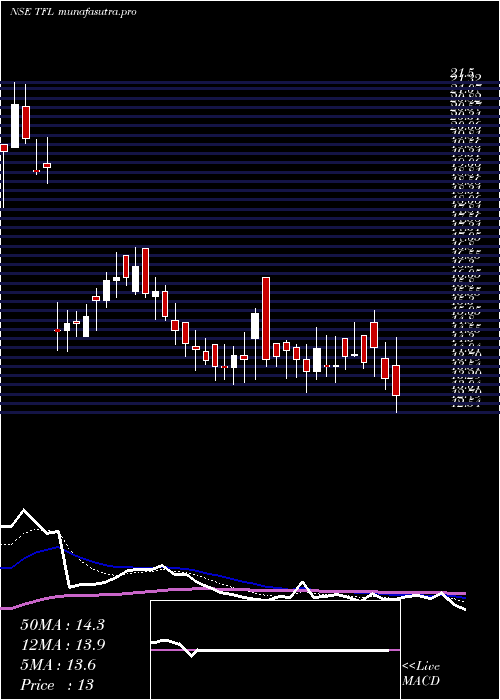
Daily price and charts and targets TranswarrantyFinance Strong Daily Stock price targets for TranswarrantyFinance TFL are 11.75 and 13.8 | Daily Target 1 | 11.33 | | Daily Target 2 | 12.16 | | Daily Target 3 | 13.376666666667 | | Daily Target 4 | 14.21 | | Daily Target 5 | 15.43 |
Daily price and volume Transwarranty Finance
| Date |
Closing |
Open |
Range |
Volume |
Wed 29 October 2025 |
13.00 (-3.42%) |
13.83 |
12.54 - 14.59 |
4.4547 times |
Tue 28 October 2025 |
13.46 (-6.01%) |
14.01 |
13.16 - 14.43 |
0.9531 times |
Mon 27 October 2025 |
14.32 (2.95%) |
14.99 |
13.51 - 15.30 |
2.2851 times |
Fri 24 October 2025 |
13.91 (-1.56%) |
14.63 |
13.75 - 14.63 |
0.1505 times |
Thu 23 October 2025 |
14.13 (0.43%) |
14.08 |
14.05 - 14.99 |
0.1561 times |
Tue 21 October 2025 |
14.07 (1.74%) |
14.54 |
13.70 - 14.55 |
0.0964 times |
Mon 20 October 2025 |
13.83 (0.29%) |
13.79 |
13.36 - 14.60 |
0.0991 times |
Fri 17 October 2025 |
13.79 (-3.36%) |
13.81 |
13.51 - 14.63 |
0.0803 times |
Thu 16 October 2025 |
14.27 (4.47%) |
13.66 |
13.43 - 14.85 |
1.3861 times |
Wed 15 October 2025 |
13.66 (-2.36%) |
13.99 |
13.10 - 14.39 |
0.3387 times |
Tue 14 October 2025 |
13.99 (-1.69%) |
14.30 |
13.50 - 14.40 |
0.272 times |
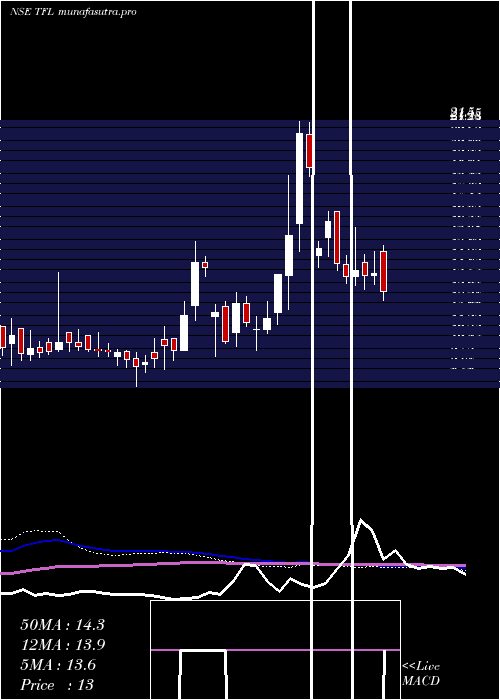
Weekly price and charts TranswarrantyFinance Strong weekly Stock price targets for TranswarrantyFinance TFL are 11.39 and 14.15 | Weekly Target 1 | 10.85 | | Weekly Target 2 | 11.93 | | Weekly Target 3 | 13.613333333333 | | Weekly Target 4 | 14.69 | | Weekly Target 5 | 16.37 |
Weekly price and volumes for Transwarranty Finance
| Date |
Closing |
Open |
Range |
Volume |
Wed 29 October 2025 |
13.00 (-6.54%) |
14.99 |
12.54 - 15.30 |
1.6738 times |
Fri 24 October 2025 |
13.91 (0.87%) |
13.79 |
13.36 - 14.99 |
0.1092 times |
Fri 17 October 2025 |
13.79 (-1.92%) |
14.43 |
13.10 - 14.85 |
0.5002 times |
Fri 10 October 2025 |
14.06 (2.11%) |
13.77 |
13.30 - 16.20 |
1.2985 times |
Fri 03 October 2025 |
13.77 (-4.44%) |
14.34 |
13.41 - 14.78 |
0.249 times |
Fri 26 September 2025 |
14.41 (-12.61%) |
17.00 |
14.05 - 17.00 |
0.3705 times |
Fri 19 September 2025 |
16.49 (8.77%) |
15.69 |
14.76 - 17.01 |
0.4152 times |
Fri 12 September 2025 |
15.16 (-20.96%) |
14.78 |
14.21 - 15.52 |
0.1802 times |
Wed 09 July 2025 |
19.18 (-8.23%) |
20.85 |
18.75 - 21.43 |
1.1516 times |
Fri 04 July 2025 |
20.90 (32.28%) |
16.40 |
15.02 - 21.50 |
4.0517 times |
Fri 10 May 2024 |
15.80 (14.08%) |
13.80 |
12.10 - 18.80 |
91.3738 times |
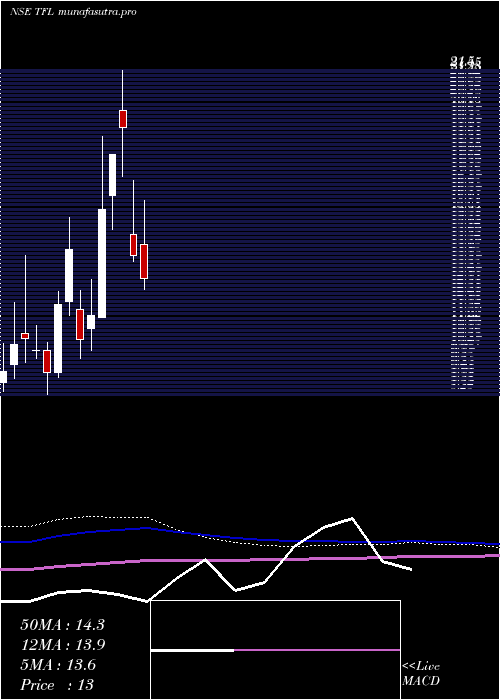
Monthly price and charts TranswarrantyFinance Strong monthly Stock price targets for TranswarrantyFinance TFL are 10.94 and 14.6 | Monthly Target 1 | 10.25 | | Monthly Target 2 | 11.63 | | Monthly Target 3 | 13.913333333333 | | Monthly Target 4 | 15.29 | | Monthly Target 5 | 17.57 |
Monthly price and volumes Transwarranty Finance
| Date |
Closing |
Open |
Range |
Volume |
Wed 29 October 2025 |
13.00 (-6.88%) |
14.39 |
12.54 - 16.20 |
0.1524 times |
Tue 30 September 2025 |
13.96 (-27.22%) |
14.78 |
13.68 - 17.01 |
0.049 times |
Wed 09 July 2025 |
19.18 (6.26%) |
19.85 |
17.16 - 21.50 |
0.1953 times |
Mon 30 June 2025 |
18.05 (14.24%) |
16.40 |
15.02 - 18.05 |
0.0232 times |
Fri 10 May 2024 |
15.80 (37.39%) |
11.40 |
11.40 - 18.80 |
5.789 times |
Tue 30 April 2024 |
11.50 (9.52%) |
10.95 |
10.05 - 12.95 |
0.8604 times |
Thu 28 March 2024 |
10.50 (-26.06%) |
11.75 |
9.75 - 12.50 |
0.6647 times |
Mon 11 December 2023 |
14.20 (18.83%) |
12.05 |
11.50 - 15.50 |
1.5927 times |
Thu 30 November 2023 |
11.95 (30.6%) |
9.15 |
8.95 - 12.45 |
0.5422 times |
Tue 31 October 2023 |
9.15 (-8.96%) |
10.05 |
8.25 - 10.40 |
0.1312 times |
Fri 29 September 2023 |
10.05 (-4.74%) |
10.05 |
9.75 - 11.10 |
0.4804 times |
DMA SMA EMA moving averages of Transwarranty Finance TFL
DMA (daily moving average) of Transwarranty Finance TFL
| DMA period | DMA value | | 5 day DMA | 13.76 | | 12 day DMA | 13.89 | | 20 day DMA | 13.97 | | 35 day DMA | 14.58 | | 50 day DMA | 15.33 | | 100 day DMA | 13.33 | | 150 day DMA | 12.23 | | 200 day DMA | 11.67 | EMA (exponential moving average) of Transwarranty Finance TFL
| EMA period | EMA current | EMA prev | EMA prev2 | | 5 day EMA | 13.59 | 13.89 | 14.1 | | 12 day EMA | 13.87 | 14.03 | 14.13 | | 20 day EMA | 14.08 | 14.19 | 14.27 | | 35 day EMA | 14.44 | 14.52 | 14.58 | | 50 day EMA | 14.85 | 14.93 | 14.99 |
SMA (simple moving average) of Transwarranty Finance TFL
| SMA period | SMA current | SMA prev | SMA prev2 | | 5 day SMA | 13.76 | 13.98 | 14.05 | | 12 day SMA | 13.89 | 13.98 | 14.02 | | 20 day SMA | 13.97 | 14.04 | 14.08 | | 35 day SMA | 14.58 | 14.75 | 14.91 | | 50 day SMA | 15.33 | 15.3 | 15.26 | | 100 day SMA | 13.33 | 13.3 | 13.27 | | 150 day SMA | 12.23 | 12.21 | 12.19 | | 200 day SMA | 11.67 | 11.65 | 11.63 |
|
|
