TexmoPipes TEXMOPIPES full analysis,charts,indicators,moving averages,SMA,DMA,EMA,ADX,MACD,RSITexmo Pipes TEXMOPIPES WideScreen charts, DMA,SMA,EMA technical analysis, forecast prediction, by indicators ADX,MACD,RSI,CCI NSE stock exchange
operates under Plastic Products sector
Daily price and charts and targets TexmoPipes Strong Daily Stock price targets for TexmoPipes TEXMOPIPES are 53.14 and 54.24 | Daily Target 1 | 52.86 | | Daily Target 2 | 53.41 | | Daily Target 3 | 53.956666666667 | | Daily Target 4 | 54.51 | | Daily Target 5 | 55.06 |
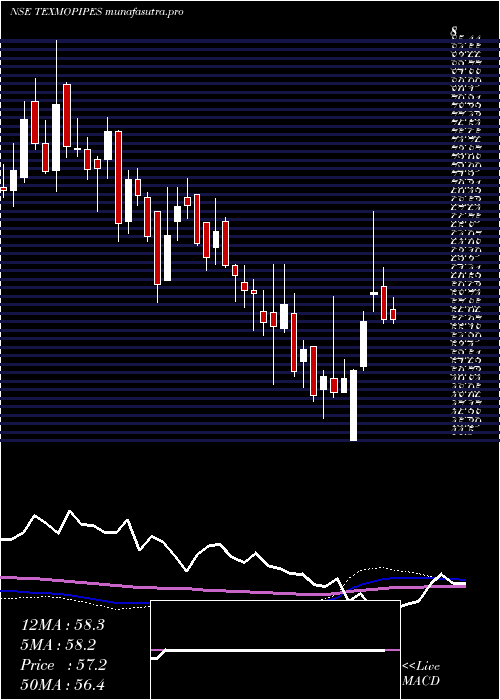
Daily price and volume Texmo Pipes
| Date |
Closing |
Open |
Range |
Volume |
Tue 28 October 2025 |
53.97 (1.07%) |
54.50 |
53.40 - 54.50 |
0.2793 times |
Mon 27 October 2025 |
53.40 (-2.34%) |
54.68 |
53.10 - 54.95 |
0.5553 times |
Fri 24 October 2025 |
54.68 (0.16%) |
55.69 |
54.01 - 55.69 |
0.3819 times |
Thu 23 October 2025 |
54.59 (-1.25%) |
55.28 |
54.50 - 55.88 |
0.3313 times |
Tue 21 October 2025 |
55.28 (-0.11%) |
56.00 |
54.17 - 56.00 |
0.2046 times |
Mon 20 October 2025 |
55.34 (2.27%) |
55.19 |
54.00 - 55.94 |
0.5055 times |
Fri 17 October 2025 |
54.11 (-1.69%) |
55.95 |
53.90 - 56.10 |
0.6893 times |
Thu 16 October 2025 |
55.04 (3.79%) |
52.90 |
52.90 - 59.94 |
6.2028 times |
Wed 15 October 2025 |
53.03 (-1.03%) |
53.12 |
52.90 - 54.25 |
0.4229 times |
Tue 14 October 2025 |
53.58 (-1.16%) |
53.90 |
53.11 - 55.50 |
0.4272 times |
Mon 13 October 2025 |
54.21 (-0.33%) |
54.39 |
53.90 - 55.79 |
0.4265 times |
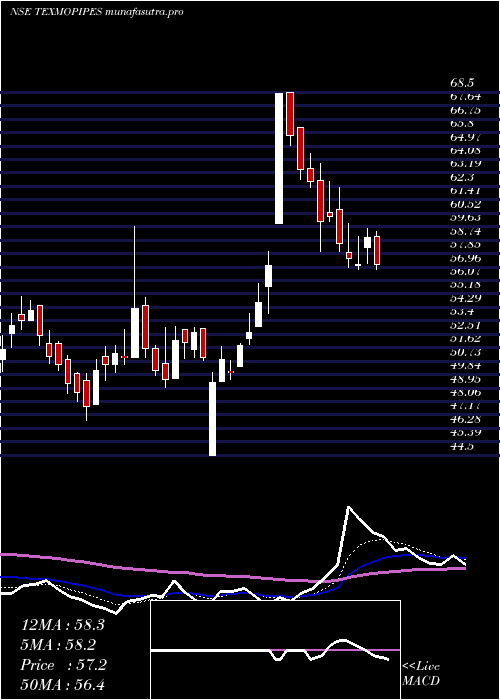
Weekly price and charts TexmoPipes Strong weekly Stock price targets for TexmoPipes TEXMOPIPES are 52.61 and 54.46 | Weekly Target 1 | 52.16 | | Weekly Target 2 | 53.06 | | Weekly Target 3 | 54.006666666667 | | Weekly Target 4 | 54.91 | | Weekly Target 5 | 55.86 |
Weekly price and volumes for Texmo Pipes
| Date |
Closing |
Open |
Range |
Volume |
Tue 28 October 2025 |
53.97 (-1.3%) |
54.68 |
53.10 - 54.95 |
0.3166 times |
Fri 24 October 2025 |
54.68 (1.05%) |
55.19 |
54.00 - 56.00 |
0.5398 times |
Fri 17 October 2025 |
54.11 (-0.51%) |
54.39 |
52.90 - 59.94 |
3.0985 times |
Fri 10 October 2025 |
54.39 (-2.86%) |
55.00 |
53.52 - 56.87 |
0.7018 times |
Fri 03 October 2025 |
55.99 (-0.36%) |
55.13 |
54.10 - 57.18 |
0.6227 times |
Fri 26 September 2025 |
56.19 (-4.97%) |
59.50 |
56.00 - 59.50 |
0.5999 times |
Fri 19 September 2025 |
59.13 (-0.52%) |
58.40 |
58.12 - 59.58 |
0.7352 times |
Fri 12 September 2025 |
59.44 (4.46%) |
56.56 |
56.37 - 62.00 |
2.0129 times |
Fri 05 September 2025 |
56.90 (1.26%) |
56.30 |
56.25 - 58.60 |
0.7113 times |
Fri 29 August 2025 |
56.19 (-4.96%) |
59.99 |
55.51 - 59.99 |
0.6613 times |
Fri 22 August 2025 |
59.12 (3.52%) |
57.00 |
56.10 - 59.80 |
1.0268 times |
Monthly price and charts TexmoPipes Strong monthly Stock price targets for TexmoPipes TEXMOPIPES are 49.92 and 56.96 | Monthly Target 1 | 48.56 | | Monthly Target 2 | 51.27 | | Monthly Target 3 | 55.603333333333 | | Monthly Target 4 | 58.31 | | Monthly Target 5 | 62.64 |
Monthly price and volumes Texmo Pipes
| Date |
Closing |
Open |
Range |
Volume |
Tue 28 October 2025 |
53.97 (-0.92%) |
54.47 |
52.90 - 59.94 |
0.4945 times |
Tue 30 September 2025 |
54.47 (-3.06%) |
56.30 |
54.10 - 62.00 |
0.4386 times |
Fri 29 August 2025 |
56.19 (-7.69%) |
60.51 |
55.51 - 61.45 |
0.3503 times |
Thu 31 July 2025 |
60.87 (-5.01%) |
64.90 |
60.30 - 68.99 |
1.0568 times |
Mon 30 June 2025 |
64.08 (3.66%) |
62.88 |
61.08 - 68.50 |
1.3282 times |
Fri 30 May 2025 |
61.82 (7.51%) |
57.05 |
53.31 - 64.40 |
0.9002 times |
Wed 30 April 2025 |
57.50 (16.09%) |
49.55 |
44.50 - 68.50 |
2.4199 times |
Fri 28 March 2025 |
49.53 (-4.25%) |
52.75 |
46.83 - 59.65 |
1.4025 times |
Fri 28 February 2025 |
51.73 (-13.67%) |
58.05 |
50.41 - 63.00 |
1.0672 times |
Fri 31 January 2025 |
59.92 (-6.14%) |
64.80 |
56.00 - 69.90 |
0.5419 times |
Tue 31 December 2024 |
63.84 (-3.29%) |
67.44 |
62.36 - 72.00 |
0.6975 times |
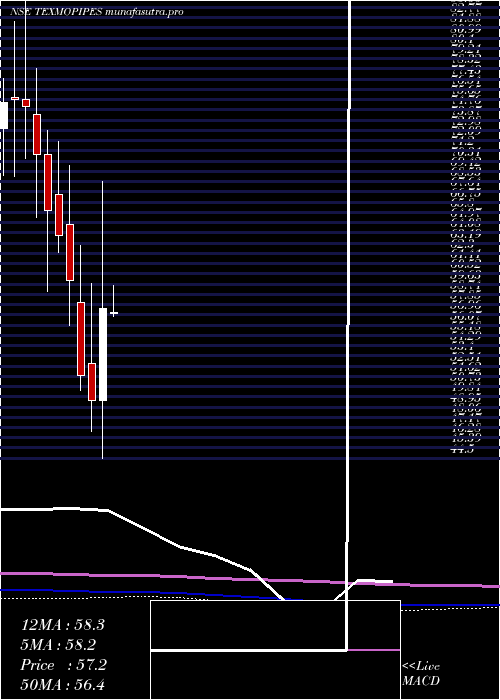
DMA SMA EMA moving averages of Texmo Pipes TEXMOPIPES
DMA (daily moving average) of Texmo Pipes TEXMOPIPES
| DMA period | DMA value | | 5 day DMA | 54.38 | | 12 day DMA | 54.3 | | 20 day DMA | 54.58 | | 35 day DMA | 56.05 | | 50 day DMA | 56.44 | | 100 day DMA | 59.56 | | 150 day DMA | 58.98 | | 200 day DMA | 58.45 | EMA (exponential moving average) of Texmo Pipes TEXMOPIPES
| EMA period | EMA current | EMA prev | EMA prev2 | | 5 day EMA | 54.18 | 54.28 | 54.72 | | 12 day EMA | 54.48 | 54.57 | 54.78 | | 20 day EMA | 54.88 | 54.98 | 55.15 | | 35 day EMA | 55.52 | 55.61 | 55.74 | | 50 day EMA | 56.35 | 56.45 | 56.57 |
SMA (simple moving average) of Texmo Pipes TEXMOPIPES
| SMA period | SMA current | SMA prev | SMA prev2 | | 5 day SMA | 54.38 | 54.66 | 54.8 | | 12 day SMA | 54.3 | 54.3 | 54.37 | | 20 day SMA | 54.58 | 54.69 | 54.92 | | 35 day SMA | 56.05 | 56.14 | 56.24 | | 50 day SMA | 56.44 | 56.52 | 56.63 | | 100 day SMA | 59.56 | 59.68 | 59.77 | | 150 day SMA | 58.98 | 58.95 | 58.92 | | 200 day SMA | 58.45 | 58.5 | 58.56 |
|
|
