TexmacoInfrastructure TEXINFRA full analysis,charts,indicators,moving averages,SMA,DMA,EMA,ADX,MACD,RSITexmaco Infrastructure TEXINFRA WideScreen charts, DMA,SMA,EMA technical analysis, forecast prediction, by indicators ADX,MACD,RSI,CCI NSE stock exchange
operates under Industrial Machinery sector
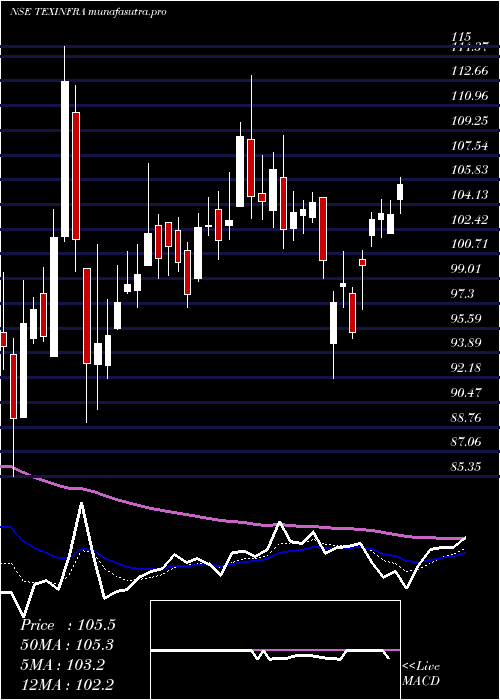
Daily price and charts and targets TexmacoInfrastructure Strong Daily Stock price targets for TexmacoInfrastructure TEXINFRA are 99.29 and 102.49 | Daily Target 1 | 98.52 | | Daily Target 2 | 100.05 | | Daily Target 3 | 101.72333333333 | | Daily Target 4 | 103.25 | | Daily Target 5 | 104.92 |
Daily price and volume Texmaco Infrastructure
| Date |
Closing |
Open |
Range |
Volume |
Wed 29 October 2025 |
101.57 (-1.22%) |
103.40 |
100.20 - 103.40 |
0.5727 times |
Tue 28 October 2025 |
102.82 (1.28%) |
99.30 |
99.30 - 103.28 |
0.8968 times |
Mon 27 October 2025 |
101.52 (3.84%) |
99.00 |
99.00 - 105.90 |
5.3635 times |
Fri 24 October 2025 |
97.77 (5.12%) |
93.25 |
93.00 - 99.00 |
1.7218 times |
Thu 23 October 2025 |
93.01 (0.77%) |
92.60 |
91.31 - 94.50 |
0.6481 times |
Tue 21 October 2025 |
92.30 (1.31%) |
91.40 |
91.40 - 92.50 |
0.0802 times |
Mon 20 October 2025 |
91.11 (-0.19%) |
91.10 |
90.90 - 91.51 |
0.1548 times |
Fri 17 October 2025 |
91.28 (-0.87%) |
92.29 |
91.01 - 92.44 |
0.2207 times |
Thu 16 October 2025 |
92.08 (-0.82%) |
92.01 |
91.86 - 93.18 |
0.1318 times |
Wed 15 October 2025 |
92.84 (1.49%) |
92.10 |
91.46 - 93.24 |
0.2095 times |
Tue 14 October 2025 |
91.48 (-1.09%) |
92.11 |
91.40 - 93.66 |
0.3069 times |
Weekly price and charts TexmacoInfrastructure Strong weekly Stock price targets for TexmacoInfrastructure TEXINFRA are 100.29 and 107.19 | Weekly Target 1 | 95.26 | | Weekly Target 2 | 98.41 | | Weekly Target 3 | 102.15666666667 | | Weekly Target 4 | 105.31 | | Weekly Target 5 | 109.06 |
Weekly price and volumes for Texmaco Infrastructure
| Date |
Closing |
Open |
Range |
Volume |
Wed 29 October 2025 |
101.57 (3.89%) |
99.00 |
99.00 - 105.90 |
1.8309 times |
Fri 24 October 2025 |
97.77 (7.11%) |
91.10 |
90.90 - 99.00 |
0.698 times |
Fri 17 October 2025 |
91.28 (-2.6%) |
93.50 |
91.01 - 94.06 |
0.3192 times |
Fri 10 October 2025 |
93.72 (-2.91%) |
96.53 |
92.90 - 97.20 |
0.5791 times |
Fri 03 October 2025 |
96.53 (-0.84%) |
97.73 |
94.21 - 97.90 |
0.5141 times |
Fri 26 September 2025 |
97.35 (2.37%) |
95.45 |
93.62 - 104.96 |
3.4591 times |
Fri 19 September 2025 |
95.10 (0.12%) |
95.10 |
94.50 - 98.95 |
0.8288 times |
Fri 12 September 2025 |
94.99 (0.72%) |
94.60 |
93.25 - 95.70 |
0.857 times |
Fri 05 September 2025 |
94.31 (0.57%) |
94.00 |
93.75 - 96.90 |
0.6537 times |
Fri 29 August 2025 |
93.78 (-3.13%) |
97.80 |
93.40 - 97.80 |
0.2602 times |
Fri 22 August 2025 |
96.81 (1.38%) |
95.00 |
94.80 - 99.50 |
0.6622 times |

Monthly price and charts TexmacoInfrastructure Strong monthly Stock price targets for TexmacoInfrastructure TEXINFRA are 96.24 and 111.24 | Monthly Target 1 | 84.46 | | Monthly Target 2 | 93.01 | | Monthly Target 3 | 99.456666666667 | | Monthly Target 4 | 108.01 | | Monthly Target 5 | 114.46 |
Monthly price and volumes Texmaco Infrastructure
| Date |
Closing |
Open |
Range |
Volume |
Wed 29 October 2025 |
101.57 (5.93%) |
96.07 |
90.90 - 105.90 |
0.4254 times |
Tue 30 September 2025 |
95.88 (2.24%) |
94.00 |
93.25 - 104.96 |
0.7163 times |
Fri 29 August 2025 |
93.78 (-5.22%) |
98.95 |
93.40 - 101.09 |
0.231 times |
Thu 31 July 2025 |
98.95 (-4.16%) |
103.37 |
96.70 - 104.71 |
0.5163 times |
Mon 30 June 2025 |
103.25 (6.16%) |
97.50 |
96.50 - 110.40 |
0.944 times |
Fri 30 May 2025 |
97.26 (0.92%) |
96.60 |
90.00 - 105.05 |
0.7237 times |
Wed 30 April 2025 |
96.37 (-5.87%) |
102.50 |
92.11 - 108.29 |
0.6556 times |
Fri 28 March 2025 |
102.38 (9.91%) |
93.10 |
90.00 - 113.03 |
1.637 times |
Fri 28 February 2025 |
93.15 (-23.23%) |
117.89 |
85.35 - 118.78 |
1.7887 times |
Fri 31 January 2025 |
121.33 (-4.85%) |
127.49 |
109.40 - 138.00 |
2.3621 times |
Tue 31 December 2024 |
127.51 (1.18%) |
125.88 |
123.93 - 159.50 |
4.2932 times |

DMA SMA EMA moving averages of Texmaco Infrastructure TEXINFRA
DMA (daily moving average) of Texmaco Infrastructure TEXINFRA
| DMA period | DMA value | | 5 day DMA | 99.34 | | 12 day DMA | 95.02 | | 20 day DMA | 94.91 | | 35 day DMA | 95.05 | | 50 day DMA | 95.23 | | 100 day DMA | 98.21 | | 150 day DMA | 99.27 | | 200 day DMA | 101.8 | EMA (exponential moving average) of Texmaco Infrastructure TEXINFRA
| EMA period | EMA current | EMA prev | EMA prev2 | | 5 day EMA | 99.64 | 98.67 | 96.6 | | 12 day EMA | 96.87 | 96.02 | 94.78 | | 20 day EMA | 95.92 | 95.33 | 94.54 | | 35 day EMA | 95.51 | 95.15 | 94.7 | | 50 day EMA | 95.81 | 95.57 | 95.27 |
SMA (simple moving average) of Texmaco Infrastructure TEXINFRA
| SMA period | SMA current | SMA prev | SMA prev2 | | 5 day SMA | 99.34 | 97.48 | 95.14 | | 12 day SMA | 95.02 | 94.37 | 93.57 | | 20 day SMA | 94.91 | 94.6 | 94.32 | | 35 day SMA | 95.05 | 94.86 | 94.62 | | 50 day SMA | 95.23 | 95.11 | 94.98 | | 100 day SMA | 98.21 | 98.27 | 98.3 | | 150 day SMA | 99.27 | 99.27 | 99.27 | | 200 day SMA | 101.8 | 101.94 | 102.05 |
|
|
