TemboGlobal TEMBO full analysis,charts,indicators,moving averages,SMA,DMA,EMA,ADX,MACD,RSITembo Global TEMBO WideScreen charts, DMA,SMA,EMA technical analysis, forecast prediction, by indicators ADX,MACD,RSI,CCI NSE stock exchange
Daily price and charts and targets TemboGlobal Strong Daily Stock price targets for TemboGlobal TEMBO are 608.63 and 621.08 | Daily Target 1 | 605.62 | | Daily Target 2 | 611.63 | | Daily Target 3 | 618.06666666667 | | Daily Target 4 | 624.08 | | Daily Target 5 | 630.52 |
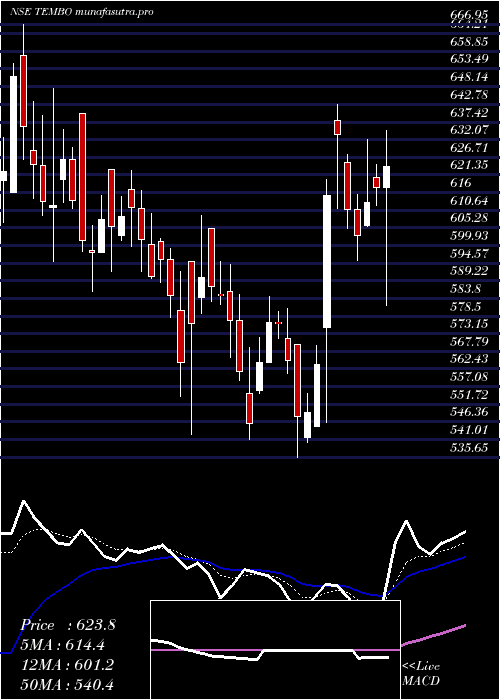
Daily price and volume Tembo Global
| Date |
Closing |
Open |
Range |
Volume |
Tue 28 October 2025 |
617.65 (0.75%) |
620.50 |
612.05 - 624.50 |
0.5382 times |
Mon 27 October 2025 |
613.05 (1.65%) |
606.00 |
605.70 - 632.00 |
0.5999 times |
Fri 24 October 2025 |
603.10 (-1.27%) |
610.85 |
595.50 - 615.50 |
0.8234 times |
Thu 23 October 2025 |
610.85 (-3.61%) |
625.00 |
605.00 - 627.40 |
0.917 times |
Tue 21 October 2025 |
633.70 (3.03%) |
638.00 |
611.05 - 642.65 |
1.5761 times |
Mon 20 October 2025 |
615.05 (9.1%) |
575.00 |
546.10 - 620.10 |
2.7426 times |
Fri 17 October 2025 |
563.75 (2.67%) |
545.05 |
545.05 - 569.60 |
0.4579 times |
Thu 16 October 2025 |
549.10 (0.21%) |
541.75 |
540.00 - 555.00 |
0.6642 times |
Wed 15 October 2025 |
547.95 (-3.01%) |
570.00 |
535.65 - 570.00 |
1.2453 times |
Tue 14 October 2025 |
564.95 (-1.97%) |
571.55 |
561.20 - 580.90 |
0.4353 times |
Mon 13 October 2025 |
576.30 (-0.03%) |
576.45 |
571.55 - 579.80 |
0.2863 times |
Weekly price and charts TemboGlobal Strong weekly Stock price targets for TemboGlobal TEMBO are 611.68 and 637.98 | Weekly Target 1 | 592.15 | | Weekly Target 2 | 604.9 | | Weekly Target 3 | 618.45 | | Weekly Target 4 | 631.2 | | Weekly Target 5 | 644.75 |
Weekly price and volumes for Tembo Global
| Date |
Closing |
Open |
Range |
Volume |
Tue 28 October 2025 |
617.65 (2.41%) |
606.00 |
605.70 - 632.00 |
0.1956 times |
Fri 24 October 2025 |
603.10 (6.98%) |
575.00 |
546.10 - 642.65 |
1.0412 times |
Fri 17 October 2025 |
563.75 (-2.2%) |
576.45 |
535.65 - 580.90 |
0.5308 times |
Fri 10 October 2025 |
576.45 (-1.42%) |
586.00 |
541.10 - 594.10 |
0.6647 times |
Fri 03 October 2025 |
584.75 (3.59%) |
594.95 |
542.55 - 609.00 |
0.6419 times |
Fri 26 September 2025 |
564.50 (-7.7%) |
611.00 |
554.10 - 616.55 |
0.9671 times |
Fri 19 September 2025 |
611.60 (1.68%) |
598.50 |
586.05 - 623.00 |
0.7987 times |
Fri 12 September 2025 |
601.50 (-3.71%) |
624.30 |
595.05 - 647.65 |
0.794 times |
Fri 05 September 2025 |
624.65 (-4.58%) |
674.95 |
607.00 - 675.00 |
1.1793 times |
Fri 29 August 2025 |
654.60 (70.29%) |
570.00 |
569.95 - 667.95 |
3.1867 times |
Thu 05 September 2024 |
384.40 (32.93%) |
293.00 |
289.00 - 417.95 |
23.1137 times |

Monthly price and charts TemboGlobal Strong monthly Stock price targets for TemboGlobal TEMBO are 576.65 and 683.65 | Monthly Target 1 | 491.65 | | Monthly Target 2 | 554.65 | | Monthly Target 3 | 598.65 | | Monthly Target 4 | 661.65 | | Monthly Target 5 | 705.65 |
Monthly price and volumes Tembo Global
| Date |
Closing |
Open |
Range |
Volume |
Tue 28 October 2025 |
617.65 (4.67%) |
605.00 |
535.65 - 642.65 |
0.3556 times |
Tue 30 September 2025 |
590.10 (-9.85%) |
674.95 |
542.55 - 675.00 |
0.5987 times |
Fri 29 August 2025 |
654.60 (70.29%) |
570.00 |
569.95 - 667.95 |
0.4464 times |
Thu 05 September 2024 |
384.40 (32.93%) |
293.00 |
289.00 - 417.95 |
3.2376 times |
Fri 30 August 2024 |
289.17 (26.31%) |
227.00 |
200.00 - 298.99 |
1.8067 times |
Wed 31 July 2024 |
228.93 (-2.26%) |
234.90 |
219.99 - 250.00 |
0.5855 times |
Fri 28 June 2024 |
234.23 (2.08%) |
230.05 |
212.95 - 249.00 |
0.4853 times |
Fri 31 May 2024 |
229.45 (0.17%) |
227.05 |
210.25 - 259.90 |
0.6574 times |
Tue 30 April 2024 |
229.05 (-8.85%) |
253.85 |
191.35 - 278.80 |
1.168 times |
Thu 28 March 2024 |
251.30 (-11.58%) |
283.80 |
248.55 - 293.00 |
0.6587 times |
Thu 29 February 2024 |
284.20 (-1.41%) |
285.05 |
266.30 - 303.90 |
0.8374 times |

DMA SMA EMA moving averages of Tembo Global TEMBO
DMA (daily moving average) of Tembo Global TEMBO
| DMA period | DMA value | | 5 day DMA | 615.67 | | 12 day DMA | 589.33 | | 20 day DMA | 582.98 | | 35 day DMA | 591.27 | | 50 day DMA | 568.54 | | 100 day DMA | 402.47 | | 150 day DMA | 347.48 | | 200 day DMA | 330.55 | EMA (exponential moving average) of Tembo Global TEMBO
| EMA period | EMA current | EMA prev | EMA prev2 | | 5 day EMA | 609.66 | 605.67 | 601.98 | | 12 day EMA | 597.01 | 593.26 | 589.66 | | 20 day EMA | 587.95 | 584.83 | 581.86 | | 35 day EMA | 565.71 | 562.65 | 559.68 | | 50 day EMA | 549.51 | 546.73 | 544.02 |
SMA (simple moving average) of Tembo Global TEMBO
| SMA period | SMA current | SMA prev | SMA prev2 | | 5 day SMA | 615.67 | 615.15 | 605.29 | | 12 day SMA | 589.33 | 584.9 | 579.3 | | 20 day SMA | 582.98 | 580.32 | 578.9 | | 35 day SMA | 591.27 | 591.47 | 592.13 | | 50 day SMA | 568.54 | 561.86 | 555.35 | | 100 day SMA | 402.47 | 398.59 | 394.74 | | 150 day SMA | 347.48 | 345.17 | 342.84 | | 200 day SMA | 330.55 | 328.94 | 327.36 |
|
|
